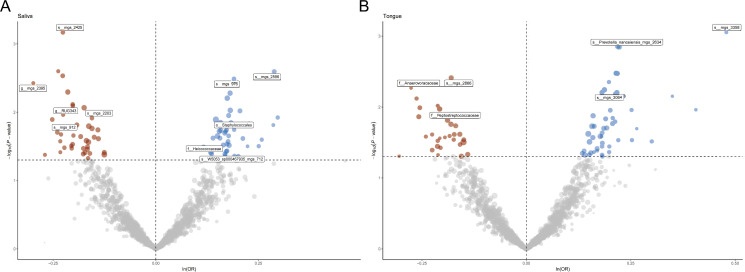
Figure 2.
(A) Volcano plot illustrating the effect of single nucleotide polymorphisms (SNPs) on various taxa in saliva samples. Points are color-coded to indicate statistical significance: significant positive associations are shown in blue, significant negative associations in red, and non-significant associations in gray. Labeled taxa represent those with the most significant associations. (B) Volcano plot illustrating the effect of single nucleotide polymorphisms (SNPs) on various taxa in tongue a samples. Points are color-coded to indicate statistical significance: significant positive associations are shown in blue, significant negative associations in red, and non-significant associations in gray. Labeled taxa represent those with the most significant associations.

