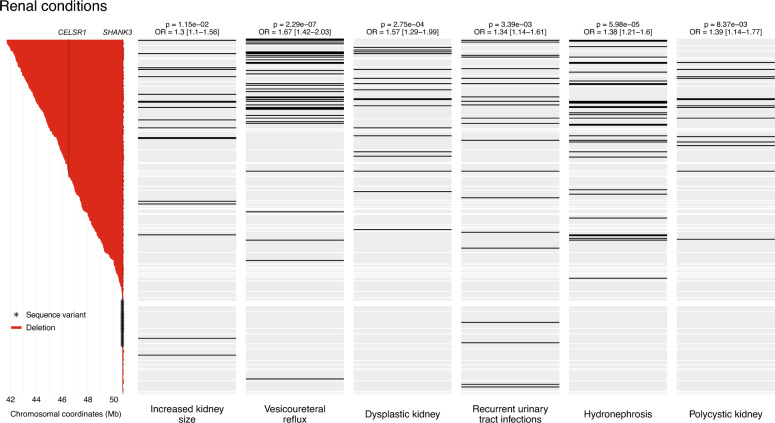
Fig. 3.
Association between deletion size and renal abnormalities. On the left: deletions (in red) and SHANK3 variants (asterisks), ordered by decreasing deletion size/position. The positions of SHANK3 and CELSR1, recently implicated in renal defects, are indicated by vertical lines. On the right: status of each patient for renal conditions, lined up with the respective genetic status. The color black indicates the presence of the phenotype, gray indicates the absence of the phenotype, and white indicates missing information

