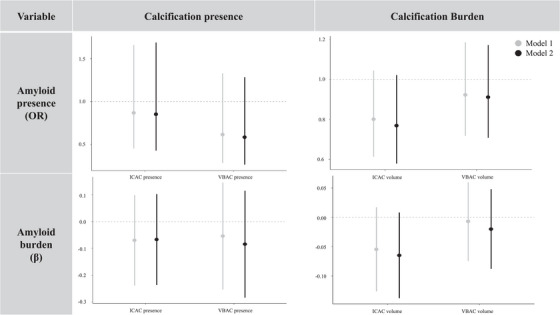
FIGURE 2.

Association of calcification presence and burden with amyloid β (Aβ) presence and burden. The bars represent regression coefficients and 95% confidence intervals. The top row shows logistic regression coefficients that were transformed into odds ratios (OR). OR = odds of Aβ positivity for calcification presence versus absence and calcification volumes (standardized ln(volume in mm3 + 1)). The bottom row shows linear regression coefficients (β). β = change in standardized Aβ burden (ln(Aβ SUVR)) for calcification presence versus absence and calcification volumes (standardized ln(volume in mm3 + 1)). ICAC, internal carotid artery calcification; SUVR, standardized uptake value ratio; VBAC, vertebrobasilar artery calcification.
