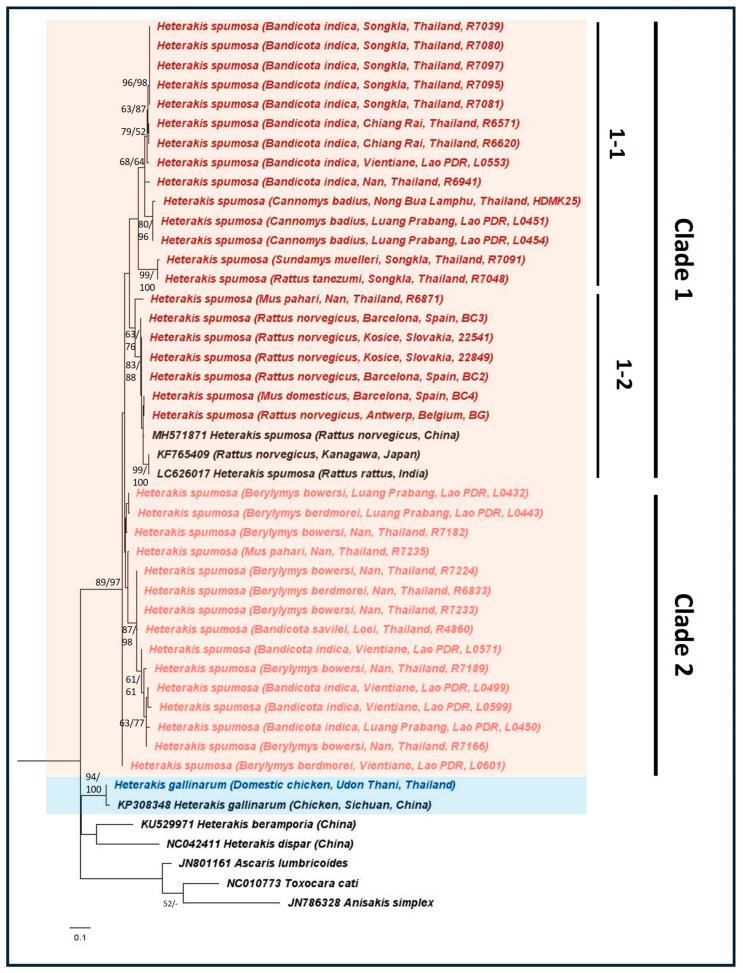
Figure 2.
Maximum likelihood (Tamura Nei + Gamma distribution parameter model) phylogeny using the mtCOI gene as the genetic marker. The numbers at the nodes indicate bootstrap support obtained through 1000 replications (ML/NJ). Only bootstrap values >50 are shown. Reference NCBI sequences are shown with their accession numbers. The representative sequences for H. spumosa and H. gallinarum are highlighted in ‘red’ and ‘blue’, respectively, with the host, location, and host ID given in parentheses. The clade divisions of H. spumosa are labeled accordingly.

