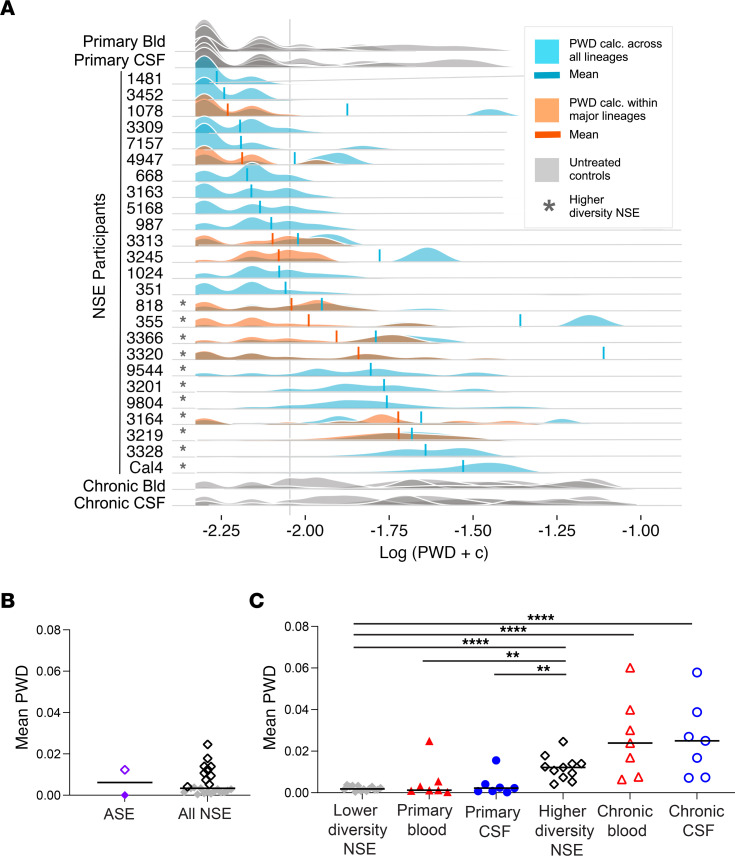
Figure 1. HIV-1 NSE populations can be very genetically diverse.
(A) To facilitate plotting on a log scale, a constant (0.005) was added to all PWD values and then log transformed. PWD was calculated across all lineages in the CSF of NSE participants (blue) and untreated controls (gray). When multiple major lineages were present in a CSF NSE population, PWD was also calculated within each major lineage, thus avoiding between-lineage comparisons (orange). Means are marked with a vertical line in orange or blue. For individuals with both types of PWD calculations (shown in blue and orange), the mean value of the within-lineage comparison (orange) was used for downstream analyses. A PWD value of 0.004 roughly separated the diversity observed during primary infection from levels observed during chronic infection. The value corresponding to this cutoff is marked with a vertical gray line. Participants with mean PWD above 0.004 are marked with an asterisk. (B) Mean PWD was calculated for the CSF of 2 participants with ASE (PWD less than 0.004, purple closed diamond; PWD above 0.004, purple open diamond; ref. 18) and 25 participants with NSE (PWD below 0.004, gray closed diamonds; PWD above 0.004, black open diamonds). Median is shown with the horizontal bar. (C) Mean PWDs of lower (n = 14) and higher (n = 11) diversity NSE populations were compared with blood- (closed red triangles, n = 7) and CSF-derived (closed blue circles, n = 7) virus from untreated primary infection and blood- (open red triangles, n = 7) and CSF-derived (open blue circles, n = 7) virus from untreated chronic infection. **P < 0.001; ***P < 0.0001; ****P < 0.0001, Mann-Whitney U test. Median value of the mean PWDs is shown with the horizontal bar.

