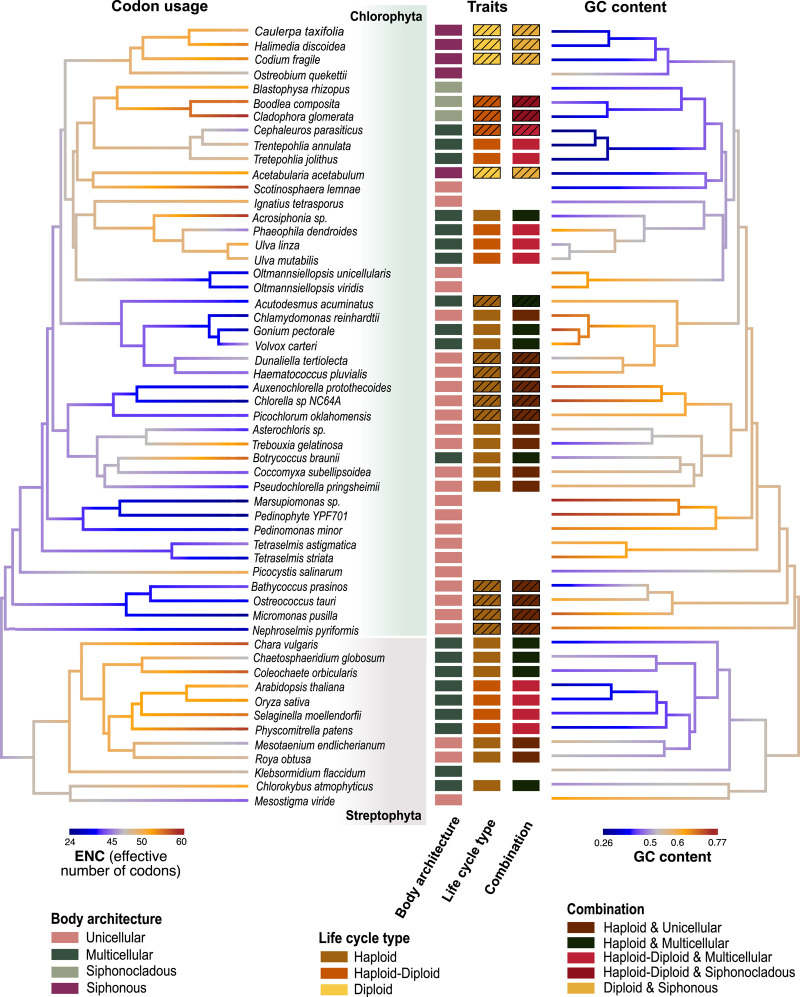
Figure 2.
Phylogeny illustrating evolutionary relationships, trait values, codon usage, and GC content across green algae. Green algal phylogeny is mapped with effective codon bias (ENC) and GC content. The center panel boxes following the names of the lineages are colored based on trait values and indicate the different categories these lineages represent in the three models: body architecture, life cycle types, and the combined (body architecture + life cycle type) models. The conservative life cycle information is indicated by plain colored boxes; extrapolated information from the more liberal data set, using boxes outlined by black borders. The phylogeny is drawn with a blue–orange gradient indicating codon bias (ENC; left) and GC content (right), showing that these traits are interrelated, as most unicellular lineages exhibit higher codon bias (lower ENC; blue) and higher GC content (orange) relative to other lineages.

