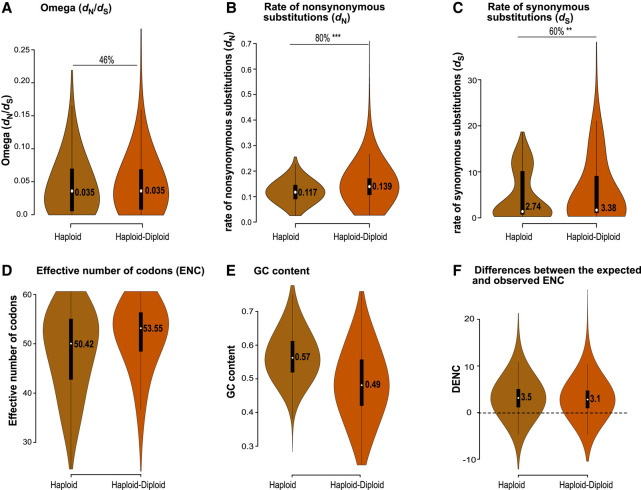
Figure 4.
Association of life cycle types with molecular evolution. The violin plots show the distribution of omega (A), rates of nonsynonymous substitutions (B), rates of synonymous substitutions (C), effective number of codons (D), GC content (E), and the difference between the expected and observed ENC (F) for lineages with haploid and haploid–diploid life cycles, based on the conserved data set described in the text. Median values are listed in the violin plot. The horizontal lines refer to comparisons across body architecture types, with indications of the percentages of genes following expected patterns in these comparisons, and the significance of the differences as given by P-values of the gene-by-gene Wilcoxon test. (*) P ≤ 0.05, (**) P ≤ 0.001, (***) P ≤ 0.0001. The lower values of dN , dS, and ENC suggest stronger selection intensity in haploid than haploid–diploid algal lineages.

