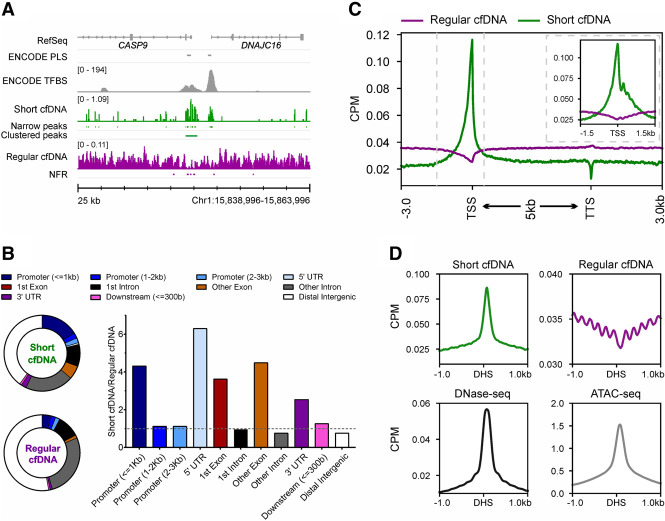
Figure 1.
Short cfDNA is enriched in regulatory regions of genes and open chromatin. (A) Coverage profile of short cfDNA (green; S03) and regular cfDNA (violet; average of S05–S08). The short cfDNA profile shows narrow and clustered peaks, whereas regular cfDNA shows nucleosome-free regions (NFRs; depletion of reads). RefSeq genes, ENCODE promoter-like structures (PLSs), and ENCODE transcription factor binding sites (TFBSs) based on ChIP-seq experiments are included as references. (B) Pie charts display the proportions of annotated genomic features for clustered peaks from short cfDNA and NFRs from regular cfDNA. The bar plot shows the ratio between clustered peaks and NFRs for each genomic feature. (C) Average coverage profiles for short cfDNA (S03) and regular cfDNA (S06) along all annotated protein-coding genes. The gene bodies of all genes are scaled to 5 kb. Dashed vertical lines indicate the interval shown in the subplot. The subplot shows average profiles at the transcription start site without rescaling of the gene body. (D) Average coverage profiles for short cfDNA, regular cfDNA, and publicly available ATAC-seq data at DNase I hypersensitive sites (DHSs) derived from publicly available DNase-seq data.

