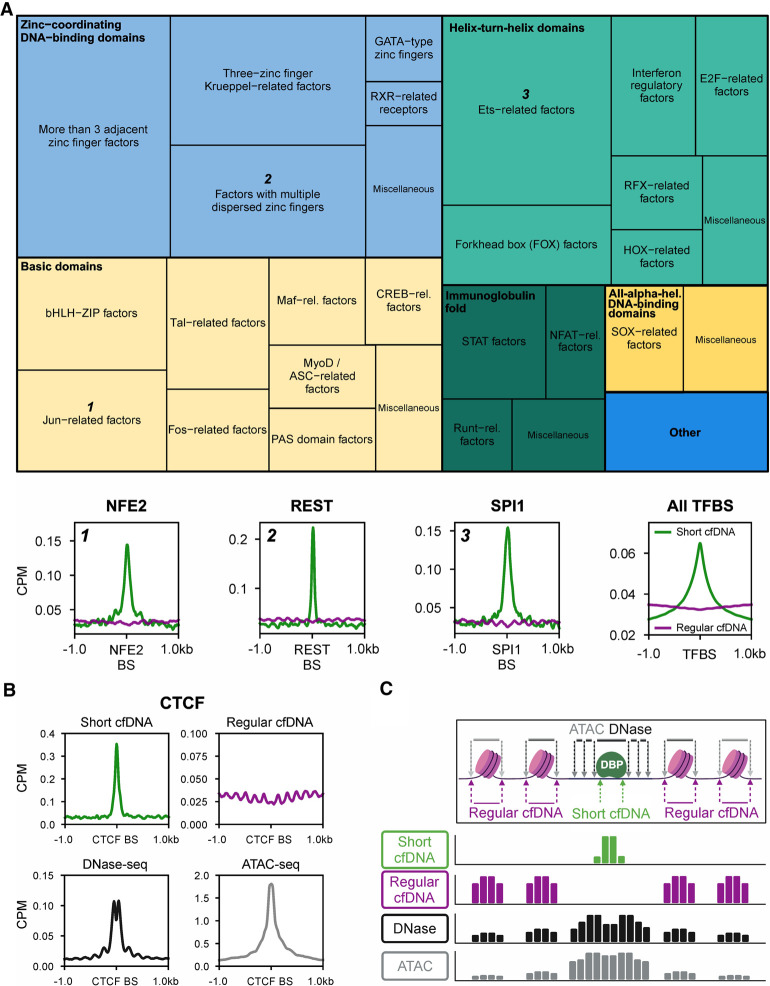
Figure 2.
Short cfDNA sequencing directly captures the protection of DNA across the genome by various transcription factors. (A) Treemap showing transcription factors whose DNA motif was significantly enriched in short cfDNA consensus peaks from four healthy individuals. More than 200 transcription factor motifs of all nine transcription factor superclasses in the database were identified as enriched in short cfDNA peaks. The size of squares in the treemap encodes the relative number of transcription factor motifs per class (thin outlined boxes) and superclass (thick outlined boxes). As examples, average coverage profiles of short cfDNA (S03) and regular cfDNA (S06) are shown for three transcription factors (NFE2, REST, and SPI1) from three different transcription factor superclasses. Average profiles are based on the 1000 most robust binding sites annotated in the Gene Transcription Regulation Database (GTRD). In addition, the average profile of all ChIP-seq TFBSs annotated in ENCODE3 is shown for short cfDNA in comparison to regular cfDNA. (B) Average coverage profile of short cfDNA, regular cfDNA, DNase-seq, and ATAC-seq at CTCF binding sites (CTCF BSs). (C) Inferred molecular model for the formation of short cfDNA at the binding site of a DNA-binding protein (DBP) surrounded by two nucleosomes on either side. Arrows indicate the endpoints of DNA fragments for the respective sequencing technique. The resulting theoretical coverage tracks are depicted for each sequencing technique.

