Figure 3.
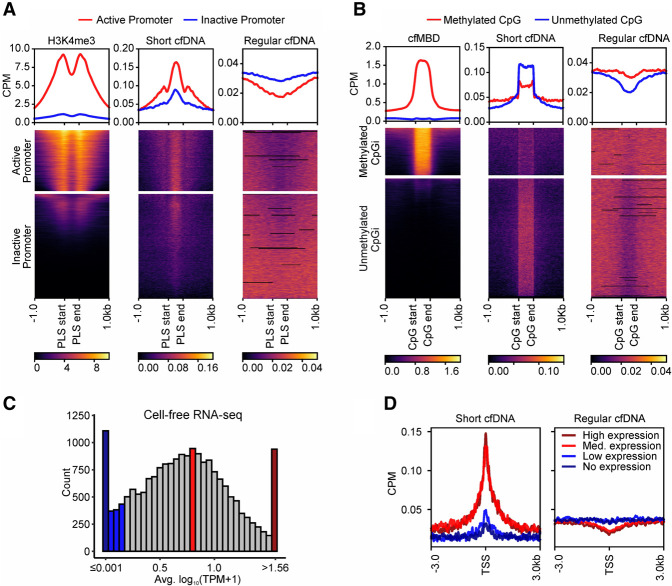
Short cfDNA is enriched at loci with markers of epigenetic activation and transcriptionally active regions. (A) Annotated PLSs from ENCODE are clustered based on publicly available cell-free H3K4me3 ChIP-seq signal strength into two clusters, representing active (red) or inactive (blue) promoters. Average coverage profiles for short cfDNA and regular cfDNA at active or inactive promoters demonstrate the influence of the promoter activation status. (B) Annotated CpG islands are clustered based on cell-free methyl-CpG-binding domain (cfMBD) sequencing signal strength into two clusters. Average coverage profiles for short cfDNA and regular cfDNA at methylated or unmethylated CpG islands reveal the influence of methylation levels at CpG islands. (C) Histogram showing average expression levels of protein-coding genes in publicly available cell-free RNA sequencing data. For each category, 5% of all analyzed genes were selected (938 genes each for no expression [dark blue], low expression [blue], medium expression [red], and high expression [dark red]). (D) Average coverage profiles for short cfDNA and regular cfDNA at the transcription start sites of the defined gene groups of C reveal the influence of transcriptional activity. All data in A and D were generated from samples of healthy individuals. S03 was used as the short cfDNA data set, and S06 was used as the regular cfDNA data set.

