Figure 4.
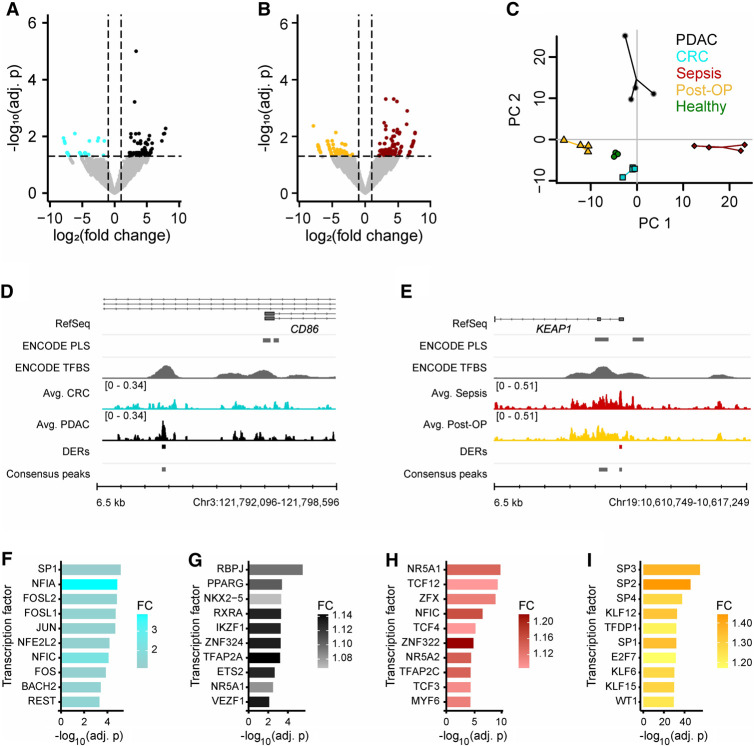
Comparison of short cfDNA data reveals condition-specific protection of TFBSs. (A) Differential enrichment analysis for pancreatic ductal adenocarcinoma (PDAC) samples with colorectal cancer (CRC) samples identifies differentially enriched TFBSs (Adj. P-value ≤ 0.05 and |log2(FC)| ≥ 1). (B) Differential enrichment analysis for sepsis samples with postoperative (Post-OP) samples identifies differentially enriched TFBSs (Adj. P-value ≤ 0.05 and |log2(FC)| ≥ 1). (C) Principal component analysis based on identified differential TFBSs separates all conditions and healthy individuals. Four biological replicates were used per condition. In addition to the samples, a centroid for each group is depicted as a larger data point. Variance explained: PC1 = 29.6%, PC2 = 20.9%. (D) Example for a differentially enriched TFBS in PDAC with novel TF binding near the alternative transcription start site of CD86. (E) Example for a differentially enriched TFBS in sepsis with novel TF binding in the promoter of KEAP1. (F–I) Top 10 differentially enriched TF motifs. (F) CRC consensus peaks in comparison to PDAC consensus peaks. CTCF and CTCFL were identified as well but were not included in the figure. (G) PDAC consensus peaks in comparison to CRC consensus peaks. (H) Sepsis consensus peaks in comparison to Post-OP consensus peaks. (I) Post-OP consensus peaks in comparison to sepsis consensus peaks. CTCF and CTCFL were identified as well but were not included in the figure.

