Figure 3.
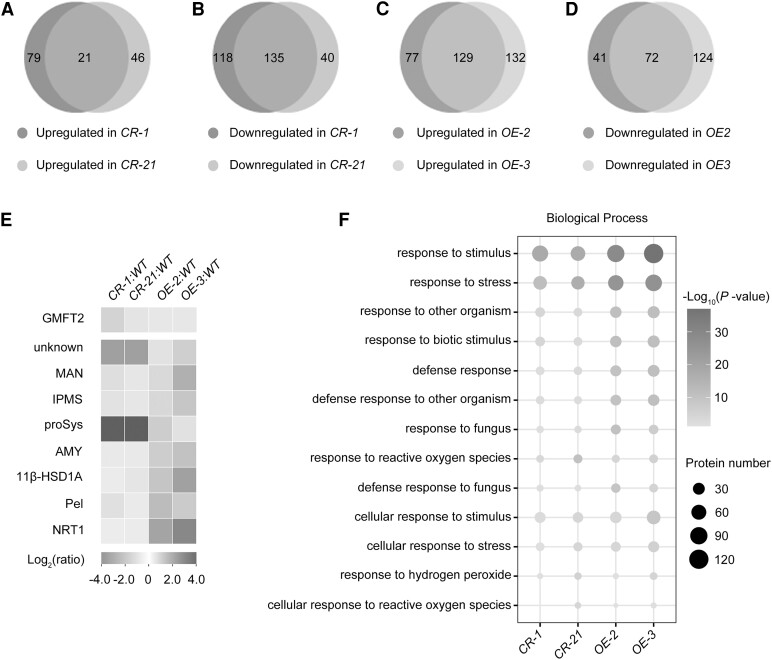
Quantitative proteome reveals altered levels of proteins associated with fruit disease resistance in Slcop1-1 mutant and SlCOP1-1 overexpression (OE) fruits compared to the wild type (WT). A) to D) Venn diagrams depicting the overlaps of upregulated proteins (A, C) and downregulated proteins (B, D), between 2 Slcop1-1 mutants, CR-1 (left) and CR-21 (right), or 2 SlCOP1-1 OE lines, OE-2 (left), OE-3 (right), compared to WT, respectively. E), Heatmap showing the expression levels of nine proteins with opposing expression changes in Slcop1-1 mutants and SlCOP1-1 OE lines. GMFT2, Glucomannan 4-beta-mannosyltransferase 2; MAN, mannan endo-1,4-beta-mannosidase; IPMS, Isopropylmalate synthase; proSys, prosystemin; AMY, 1,4-alpha-glucan-maltohydrolase; 11β-HSD1A, 11-beta-hydroxysteroid dehydrogenase 1A; Pel, pectate lyase; NRT1, NRT1/PTR FAMILY 1.1. F) Heatmap displaying enriched Gene Ontology (GO) terms associated with the resistant response to disease in Slcop1-1 mutant (CR-1, CR-21) and SlCOP1-1 OE (OE-2, OE-3) fruits (P < 0.05, Fisher's exact test). Proteins isolated from 2 Slcop1-1 mutants, 2 SlCOP1-1 OE lines, and the wild-type fruits at 33 d post anthesis (dpa) were labeled with Tandem Mass Tag (TMT) and subjected to nanoLC-MS/MS. Differentially expressed proteins were identified by 3 independent proteome analyses, with each protein showing a fold change >1.5 or < 0.67 (P < 0.05, background-based t-test).

