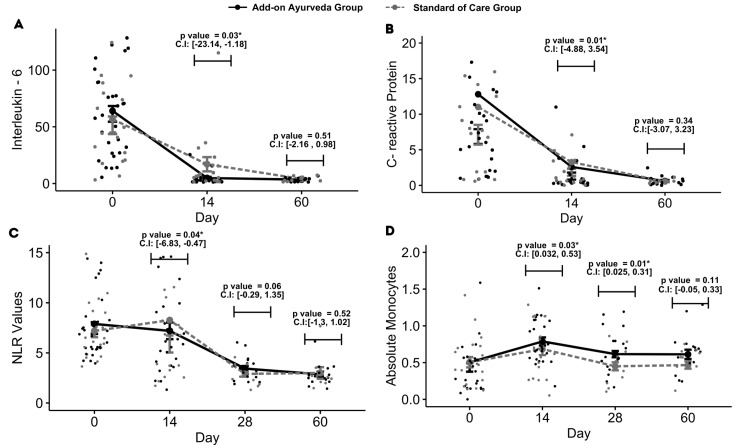
Figure 2. Changes in primary outcomes.
A, B, C, D depicts mean value of patients over time in add-on ayurveda group and standard of care for IL-6, CRP, neutrophils to lymphocytes ratio, and absolute monocytes.
*p-value computed using robust regression controlling for baseline differences between group on the particular visit.

