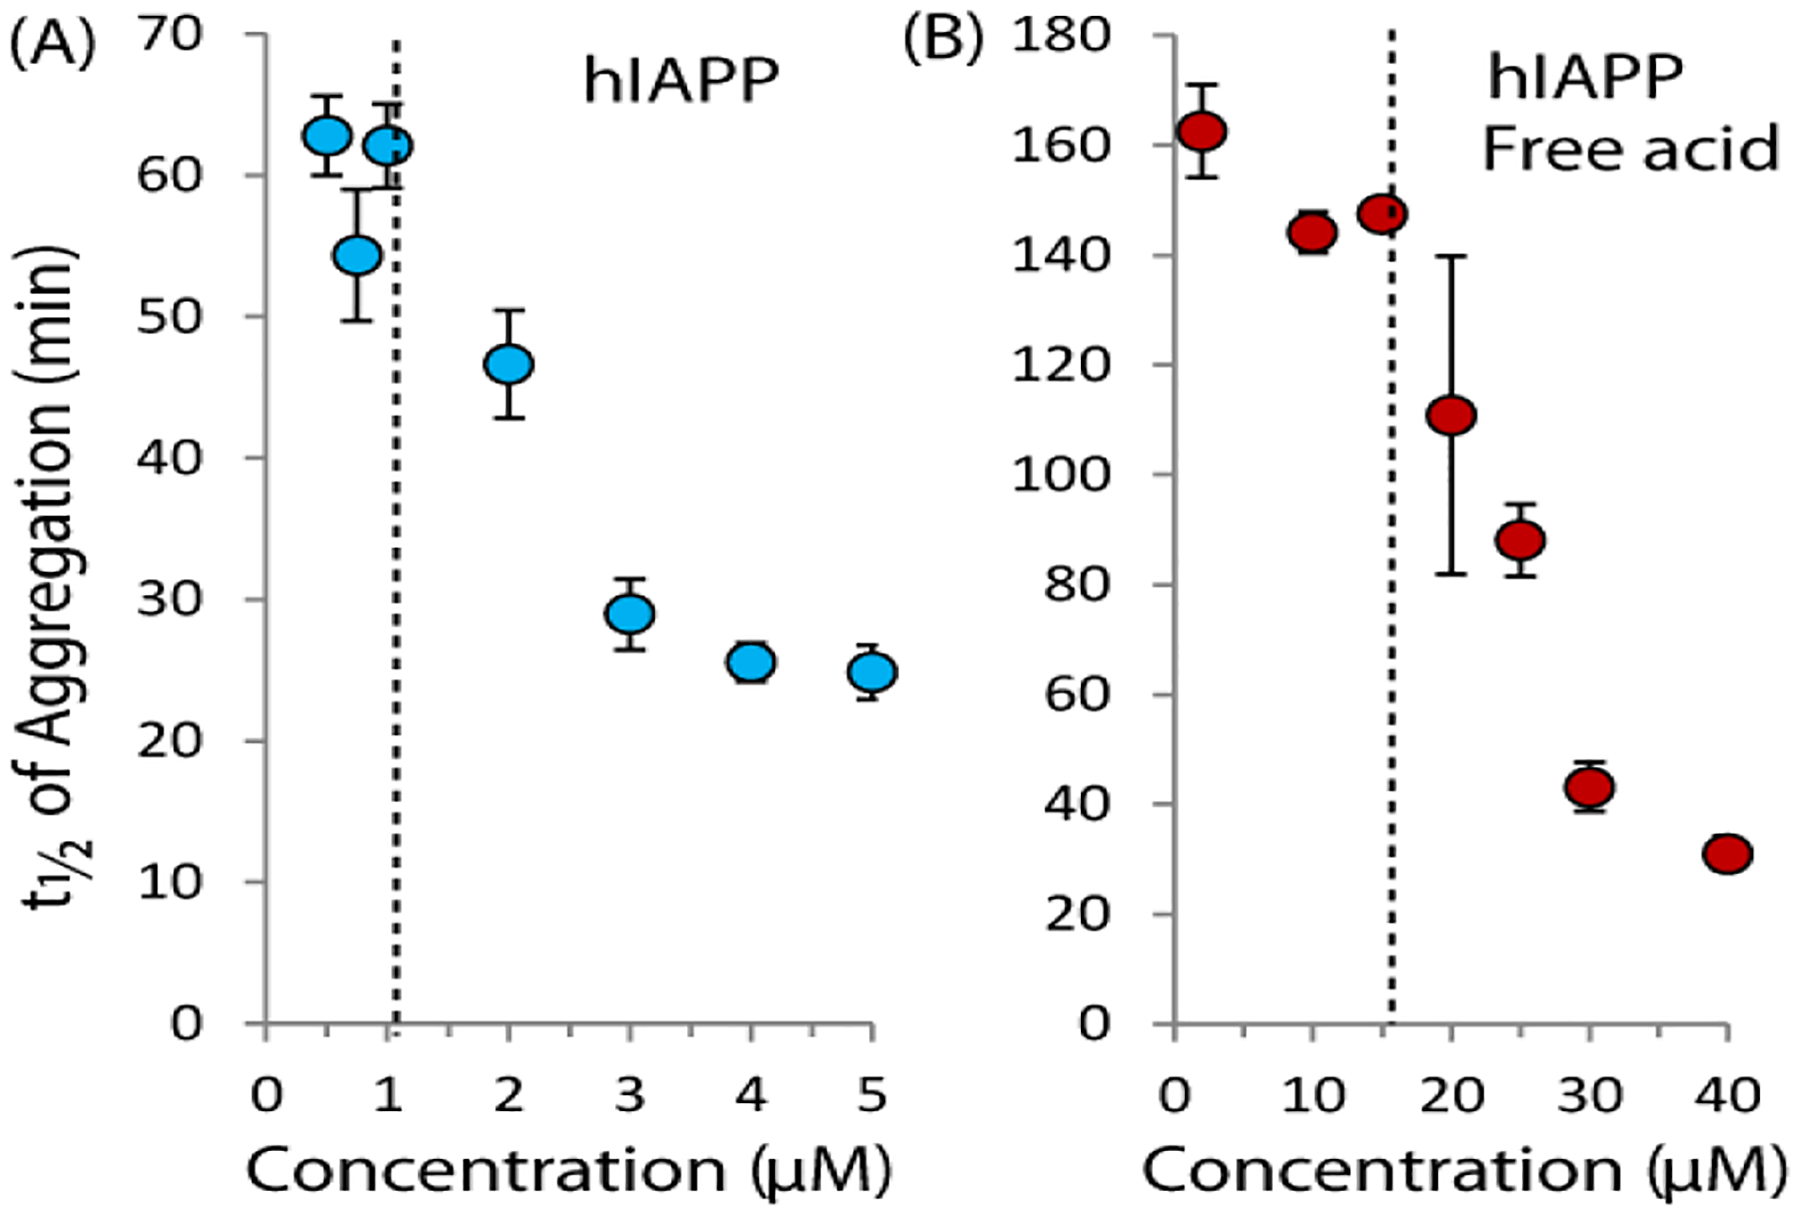
Figure 1. The rate of amyloid formation of hIAPP increases sharply near a threshold concentration.

Time to one half completion of amyloid formation as a function of hIAPP concentration for the native amidated hIAPP sequence (left) and the free acid version (right) as measured by the amyloid specific dye ThT at 25°C with orbital shaking (pH 7.3 10 mM sodium phosphate buffer, 100 mM NaCl). The dashed lines indicate the approximate threshold concentrations from the aggregation experiment. Error bars represent S.E.M. for six (hIAPP) or three (hIAPP free acid) experiments.
