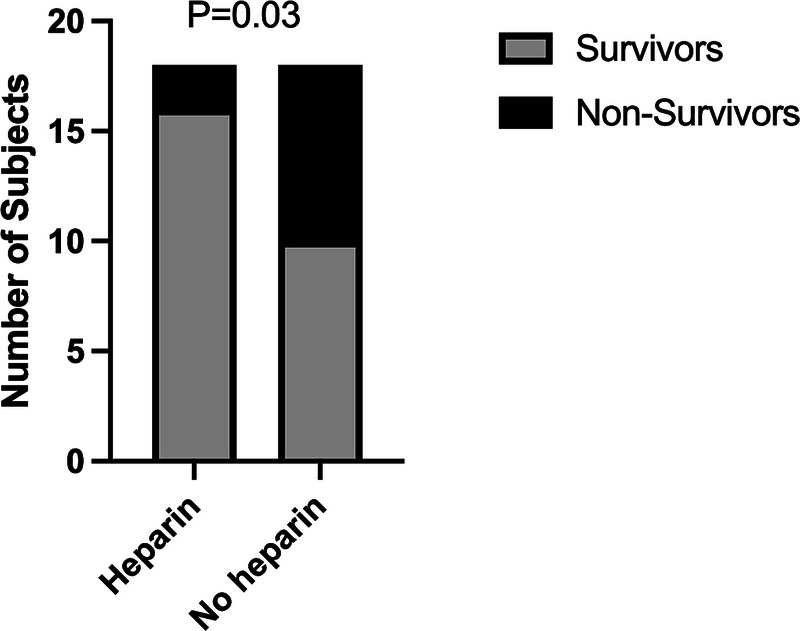
Figure 2.

Traumatic brain injury VV ECMO heparin exposure by survivors and nonsurvivors. The x axis identifies exposure to heparin during the VV ECMO course. The y axis is the number of subjects in each group. The legend denotes survivors and nonsurvivors. p Values compare heparin exposure between survivors and nonsurvivors.
