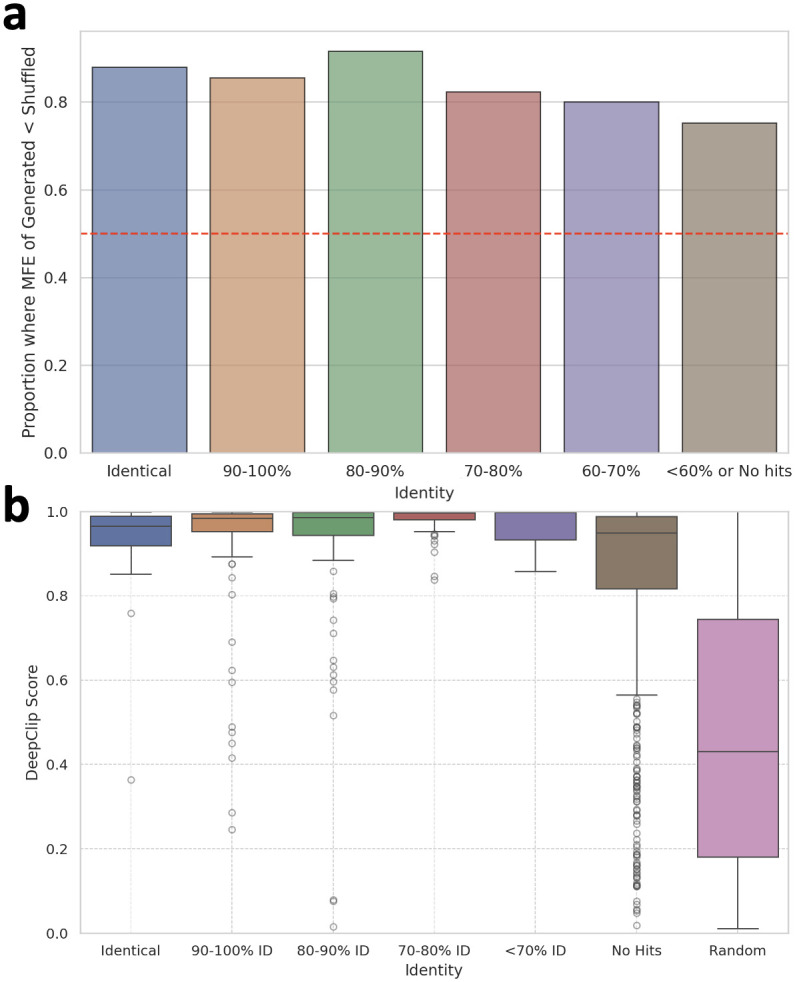
Fig 5.

a. The ratio of sequences exhibiting lower MFE compared to their corresponding shuffled sequences at diverse identity levels. b. Distribution of affinity scores with the target protein (ELAVL1) at varying identity levels and with a randomly shuffled group (Results for SRSF1 are shown in S6 Fig in S1 File). a.&b. It is observed that numerous instances of RNA with stable secondary structures or high affinity scores can be found even among sequences with an identity of less than 90% or those that are non-hits.
