
Figure 3.
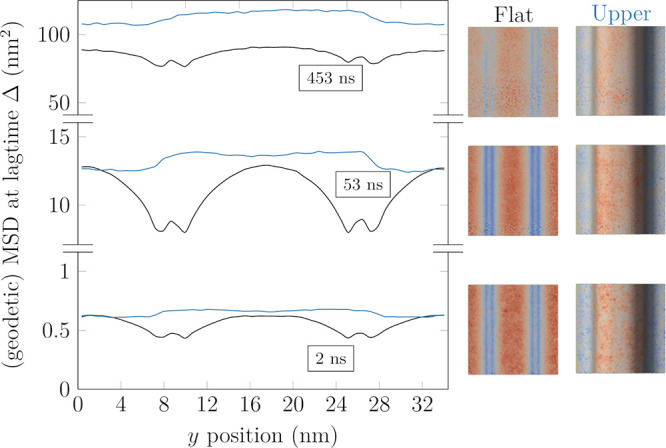
Two dimensional (“Flat”, discarded z coordinate, shown in black) and geodetic (“Upper”, for upper leaflet, shown in blue) MSD values at selected lag times (Δ = 2, 53, 453 ns from bottom upward) as a function of the position along the y axis in the “Wave” system. The values in the “Flat” system are averaged across both leaflets. The “Lower” leaflet is a shifted version of the “Upper” leaflet, and as such, it is omitted. The images on the right illustrate the distributions of MSD values at the corresponding lag times.