
Figure 4.
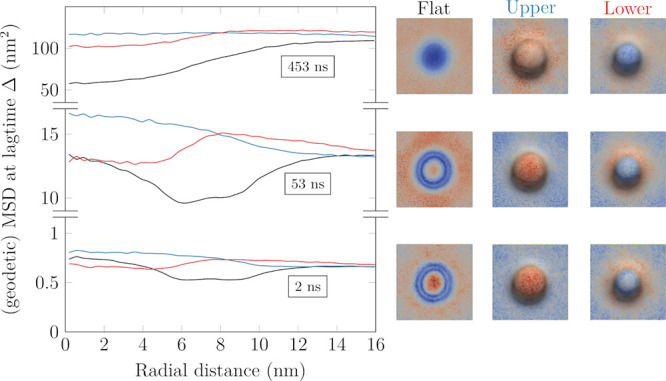
Two dimensional (“Flat”, discarded z coordinate, shown in black) and geodetic (“Upper” and “Lower” leaflet, shown in blue and red, respectively) MSD values at selected lag times (Δ = 2, 53, 453 ns from bottom upward) as a function of the distance from the center of the bud in the “Budded” system. The values in the “Flat” system are averaged across both leaflets. The images on the right illustrate the distributions of MSD values at the corresponding lag times.