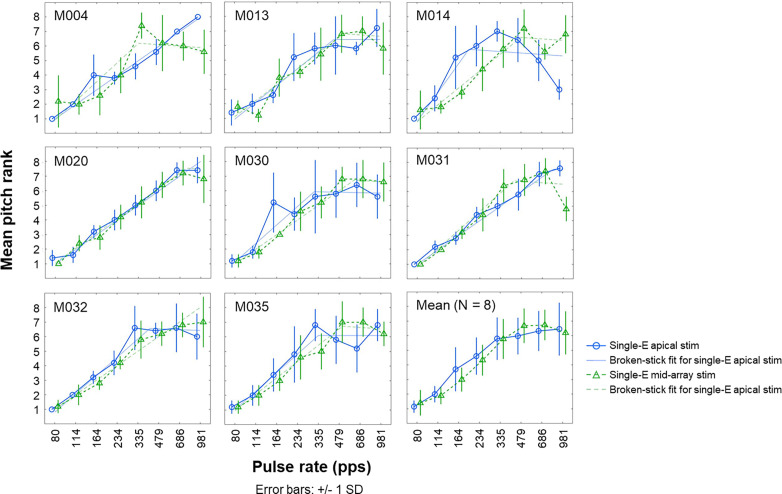
FIG. 6.
(Color online) Mean rate-pitch ranks and SD obtained from five runs of the midpoint comparison procedure for individual participants and averaged across participants (bottom right). Full and dashed lines with round and triangle markers show the single-electrode apical (Single-E apical stim) and mid-array (Single-E mid-array stim) stimulation conditions, respectively. Full and dashed faded lines show the broken-stick functions fitted to the data for the single-electrode apical and mid-array stimulation conditions, respectively. Upper limit values presented in Table II are defined as the pulse rate corresponding to the intersection between the two straight lines that make up the broken-fit function.

