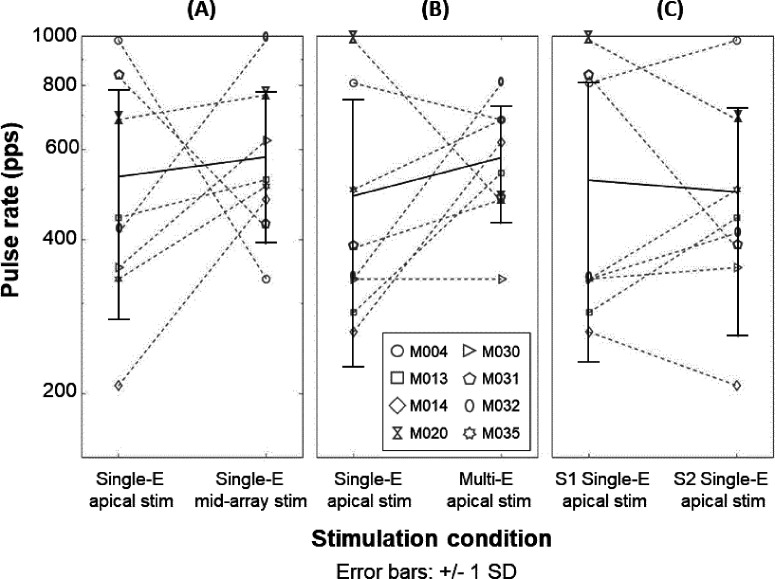
FIG. 7.
Upper limit of temporal pitch perception for individual participants (dashed gray lines) and the mean and SDs across participants (black). (A) shows the comparison between single-electrode apical and mid-array stimulation. (B) shows the comparison between single-electrode and multi-electrode apical stimulation. Note that rate-pitch ranking for single-electrode apical stimulation was measured on both sessions, and only those conditions measured during the same session are compared. The comparison between single-electrode apical stimulation in session 1 (S1) and session 2 (S2) is shown in (C). Table II reports the upper limit values for individual participants presented here.

