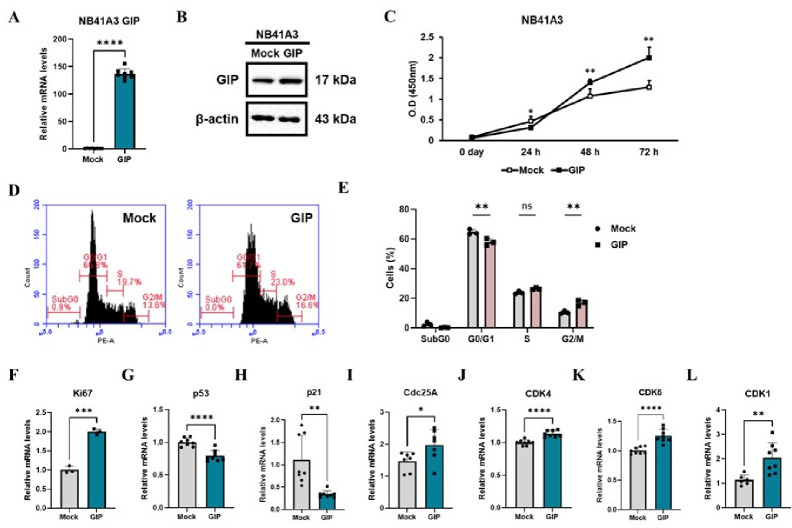
Fig. 1.
GIP overexpression facilitates cell proliferation through a well-coordinated cell cycle progression in NB41A3 cells. The (A) mRNA expression and (B) protein levels of GIP were confirmed in mock and GIP overexpressing cells using qRT-PCR and Western blotting, respectively. (C) The rate of cell proliferation was analyzed daily using CCK-8 assays until 72 h to compare proliferation between the control (Mock) and GIP overexpressing cells. (D) NB41A3 cells were collected and stained with PI to monitor cell cycle profiles for a FACS analysis. (E) A bar graph displaying the percentage of cells in each cell phase. (F–L) Real-time qPCR was used to measure the relative mRNA expression levels of cell cycle markers. Data from three independent experiments are presented as means ± SEM, and t-tests were performed to assess statistical significance: *P < 0.05; **P < 0.01; ***P < 0.001; ****P < 0.0001.

