Fig. 3.
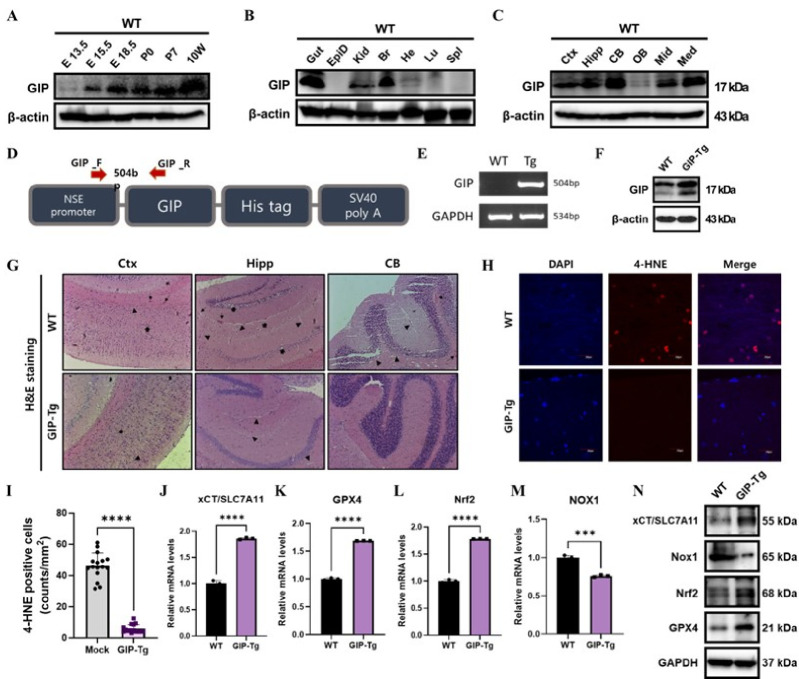
GIP-overexpressing TG mice exhibit reduced aging-induced ferroptosis. (A) Western blotting analyses were performed to detect GIP protein expression in whole brain sections by period. (B) Proteins, including the gut, epididymis (EpiD), kidney (Kid), brain (Br), heart (He), lung (Lu), and spleen (Spl), in tissue samples from 11-week-old C57BL/6J WT mice were analyzed through western blotting. And (C) The cortex (Ctx), hippocampus (Hipp), cerebellum (CB), olfactory bulb (OB), midbrain (Mid), and medulla (Med) regions of WT mice were determined for GIP expression level. (D) A schematic showing the construction of the GIP-overexpression vector. (E) In TG mice, GIP-overexpression was confirmed using RT-PCR with primers targeting the transfected protein. (F) GIP level in mouse whole brain was analyzed in WT and GIP-Tg mice. (G) Light microscopy images of H&E-stained brain sagittal sections collected from 1-year-old mice (n = 3). (magnification: bar 100 μm). Thin arrows indicate intracerebral hemorrhages around blood vessels, and thick arrows indicate pyknotic nuclei. (H) Confocal microscopy images of cells stained with DAPI and immunostained for 4-HNE (red) in 1-year-old WT and GIP-TG mice, merged staining images are included on the right (scale bars represent 20 μm). (I) Quantification of 4-HNE positive cells (counts/mm2). (J-M) mRNA levels of ferroptosis markers were assessed by qRT-PCR. (N) Protein levels of ferroptosis markers were evaluated by western blot. All data are presented as the mean ± SEM (n = 3), and t-tests were performed to evaluate statistical significance: ***P < 0.001 and ****P < 0.0001.

