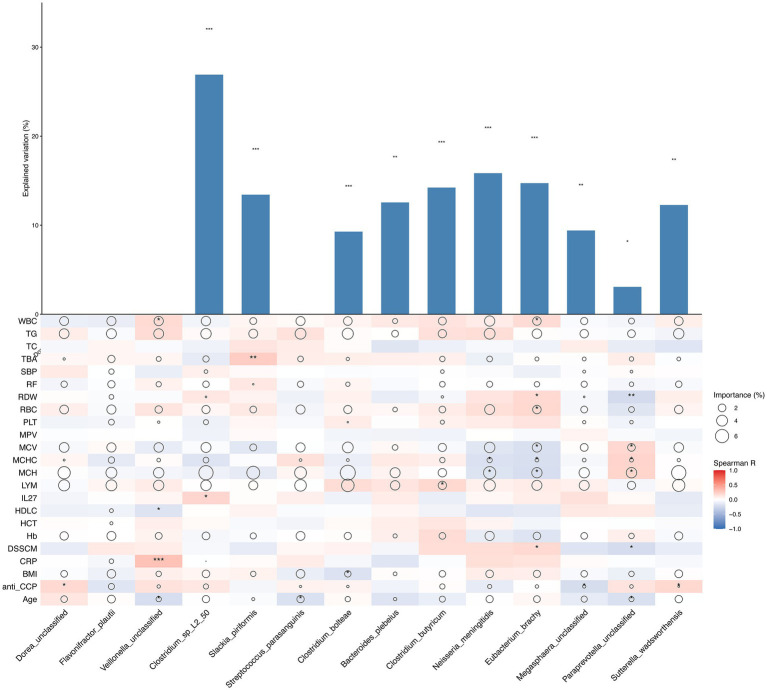
Figure 3.
Contribution of phenotype to species relative abundance differences on the basis of correlation analysis and a random forest model between different groups (BCG vs. DCG; AG vs. NG; DCNG vs. DCAG vs. BCNG vs. BCAG). The size of each circle denotes the variable importance [calculated by means of multiple regression modeling and variance decomposition analysis (Maaslin2)]. Colors denote the strength of the Spearman correlation coefficients.

