
Figure 2.
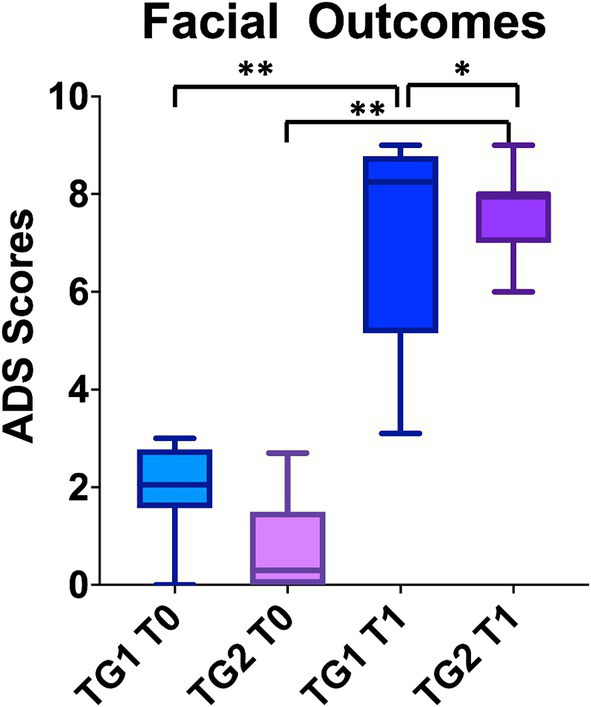
The graph bar compares the facial outcomes between the two groups at the baseline and at the end of the treatment. Higher the score better the facial motility. To note ADS scale considers synkinesis also, which presence decrease the final score. Despite both groups recovered from the baseline, the patients in TG2 group had better ADS scores. “*” p < 0.05, “**” p < 0.01.