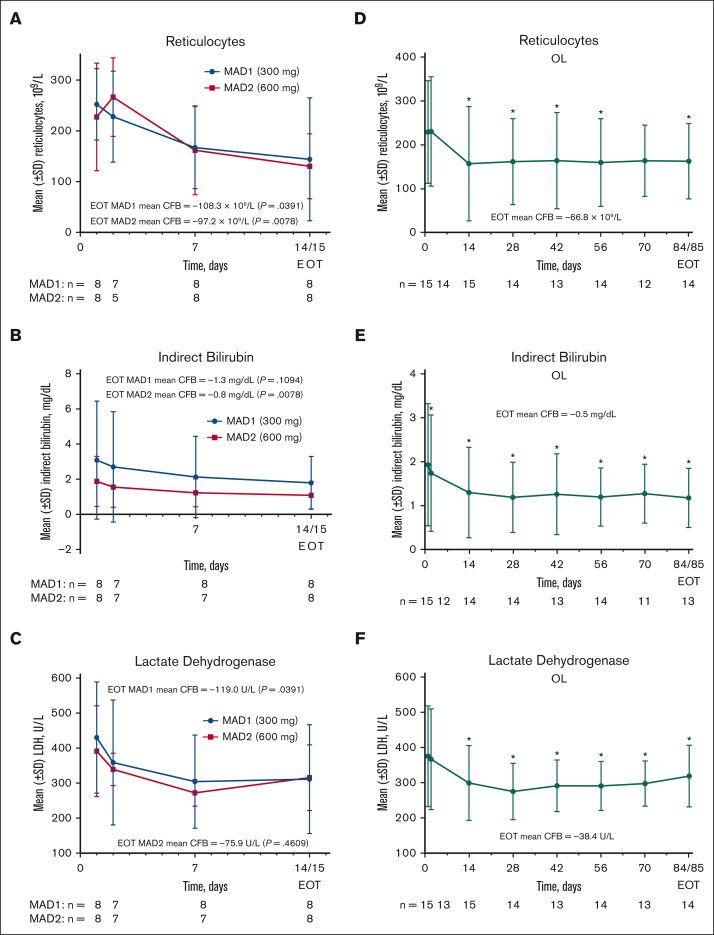
Figure 5.
Hemolysis markers in patients with SCD (MAD and OL cohorts). Mean (± SE) absolute reticulocytes, iBIL, and LDH over time in the MAD cohorts (A,B,C, respectively) and OL cohorts (D,E,F, respectively). In the MAD cohorts (A-C), P values were based on Wilcoxon signed rank tests to test the changes at EOT from BL. In the OL cohort (D-F), hemolysis marker values with statistical significance as compared with BL were identified using an asterisk (∗P ≤ .05) at their scheduled visits, based on MMRM, which included hemolysis marker values as a dependent variable, and a fixed effect of scheduled visits during the treatment period. An unstructured covariance was used for LDH and reticulocytes, and a compound symmetry covariance was used for iBIL. Statistical tests were not performed for the visits after EOT. BL, baseline; CFB, change from baseline; EOT, end of treatment; iBIL, indirect bilirubin; LDH, lactate dehydrogenase; MAD, multiple ascending dose; MMRM, mixed model for repeated measurement; OL, open-label; SCD, sickle cell disease; SD, standard deviation.

