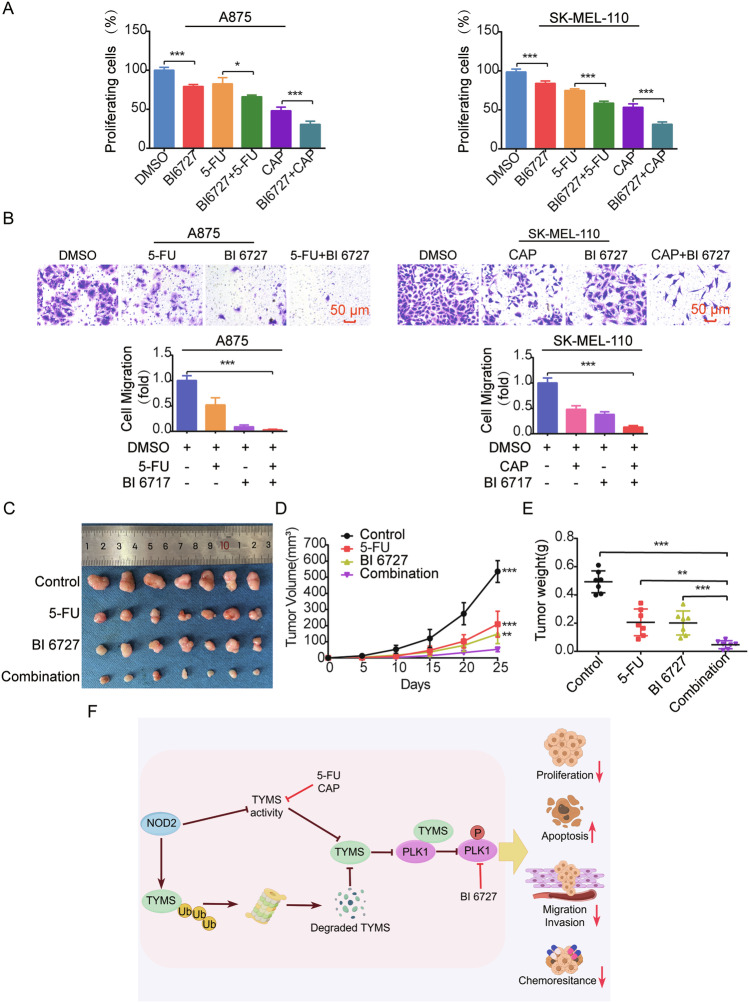
Fig. 10. Combination therapy targeting inhibition of TYMS and PLK1 suppresses melanoma progression both in vitro and in vivo.
A MTS assay was used to determine the proliferation of A875 and SK-MEL-110 cells after treatment with BI6727, 5-FU, and CAP, respectively, as well as combined treatment with BI6727 and 5-FU, BI6727, and CAP for 24 h. B Transwell migration assay was used to determine the 24-h cell migration capacity of A875 cells after treatment with BI6727 combined with 5-FU and SK-MEL-110 cells after treatment with BI6727 combined with CAP. 5-FU (5 μg/ml), CAP (2 mM), BI6727 (100 nM). Scale = 50 μm. C–E Nude mice were injected subcutaneously with 1 × 10⁷ of A875 cells. After tumor formation, they were injected intraperitoneally with saline, 5-FU (25 mg/kg), BI6727 (10 mg/kg), and combined 5-FU and BI6727, respectively (n = 7 per group). Mice were euthanized, and the tumors were peeled off and photographed (C). Tumor volumes were monitored, and growth curves were plotted (D). Tumor weights were measured (E). F Model diagram of the role and mechanism of NOD2 in melanoma. Data are expressed as the mean ± SD. Student’s t-test and one-way ANOVA were used to compare the differences. *P < 0.05, **P < 0.01, ***P < 0.001.

