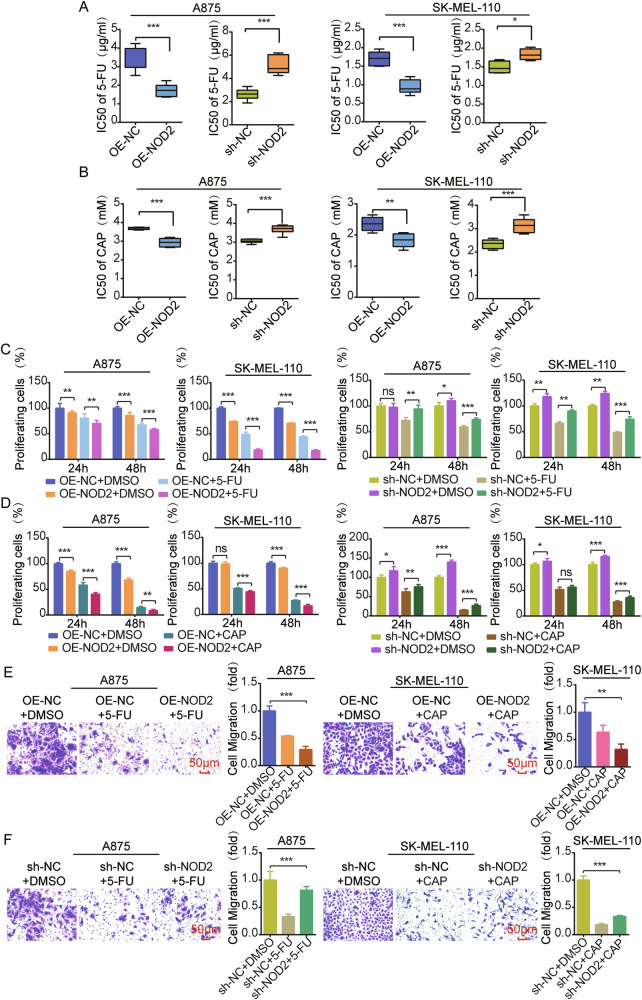
Fig. 9. NOD2 reduces chemoresistance targeting TYMS in melanoma.
A, B MTS assay to determine the IC50 values of NOD2 knockdown and overexpression in A875 and SK-MEL-110 cells after 48 h treatment with 5-FU (5 μg/ml) and CAP (2 mM). C, D MTS assay was performed to determine the proliferation of A875 and SK-MEL-110 cells with overexpression and knockdown of NOD2 after treatment with 5-FU and CAP. E Transwell migration assay was used to assess the migration ability of A875 cells with overexpression of NOD2 after 5-FU treatment and SK-MEL-110 cells with overexpression of NOD2 after CAP treatment. Scale = 50 μm. F Transwell migration assay was used to assess the migration ability of A875 cells with knockdown of NOD2 after 5-FU treatment and SK-MEL-110 cells with knockdown of NOD2 after CAP treatment. Scale = 50 μm. Data are expressed as the mean ± SD. Student’s t-test and one-way ANOVA were used to compare the differences. *P < 0.05, **P < 0.01, ***P < 0.001. ns not significant.

