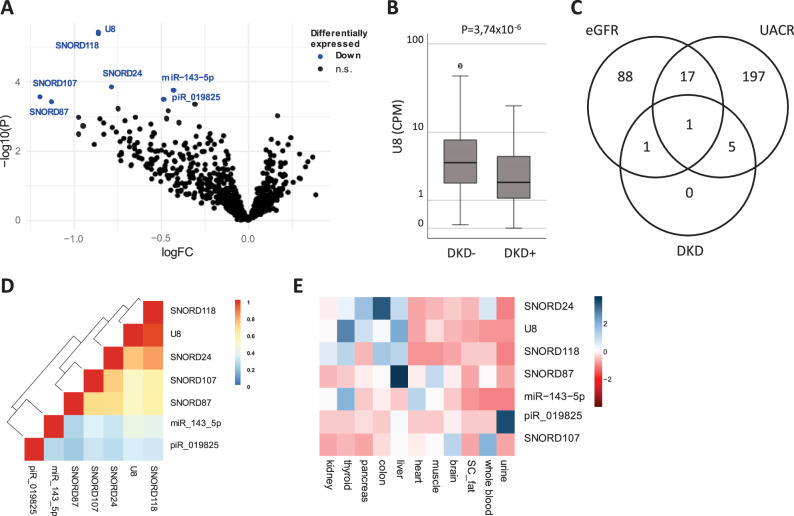
Fig. 1.
sncRNAs significantly associated with DKD. A Volcano plot showing the association between sncRNAs and DKD in the base model. sncRNAs in blue are significantly lower is cases with DKD after multiple hypothesis testing (FDR ≤ 0.05). logFC is the Log2 of the fold change between cases and controls. B U8 levels in those with or without DKD. CPM counts per million reads. C Overlap between sncRNAs significantly associated with DKD, eGFR, or UACR in the base model. D Pairwise correlations for the seven sncRNAs associated with DKD. Colors represent Spearman’s rho. E Expression pattern for sncRNAs associated with DKD in publicly available datasets for 11 tissues of interest. Colors represent the Z-scaled expression of a sncRNA where blue indicates relative high expression and red relative low expression

