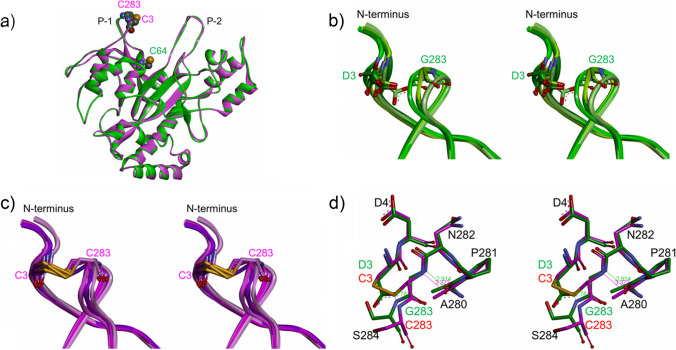
Fig. 4.
Structural comparisons between wild-type MTG and D3C/G283C MTG. The structures of wild-type MTG and D3C/G283C MTG are shown in green and purple, respectively. a Superimposed ribbon models (front views) of the overall structures of the MTG molecules B in both crystal structures. The mutated residues C3 and C283 in D3C/G283C MTG and the catalytic residue C64 in wild-type MTG are shown with sphere models. Labels P-1 and P-2 indicate two protrusions which construct the active site cleft. b Superimposed ribbon models of protrusions P-1 of the MTG molecules A, B, C, and D in the wild-type MTG crystal structure (stereo view). Residues D3 and G283 are shown with stick models. In the order of A, B, C, and D, the green color scheme of the molecule changes from dark to light. c Superimposed ribbon models of protrusions P-1 of the MTG molecules A, B, C, and D in the D3C/G283C MTG crystal structure (stereo view). Residues C3 and C283 are shown with stick models. In the order of A, B, C, and D, the purple color scheme of the molecule changes from dark to light. d Superimposed stick models of the structures around the mutation sites of the MTG molecules A in both crystal structures (stereo view). Hydrogen bonds observed only in the wild-type MTG crystal structure are represented with green lines accompanied by the atomic distances (Å unit). Corresponding atomic distance in the D3C/G283C MTG is represented with purple line and character

