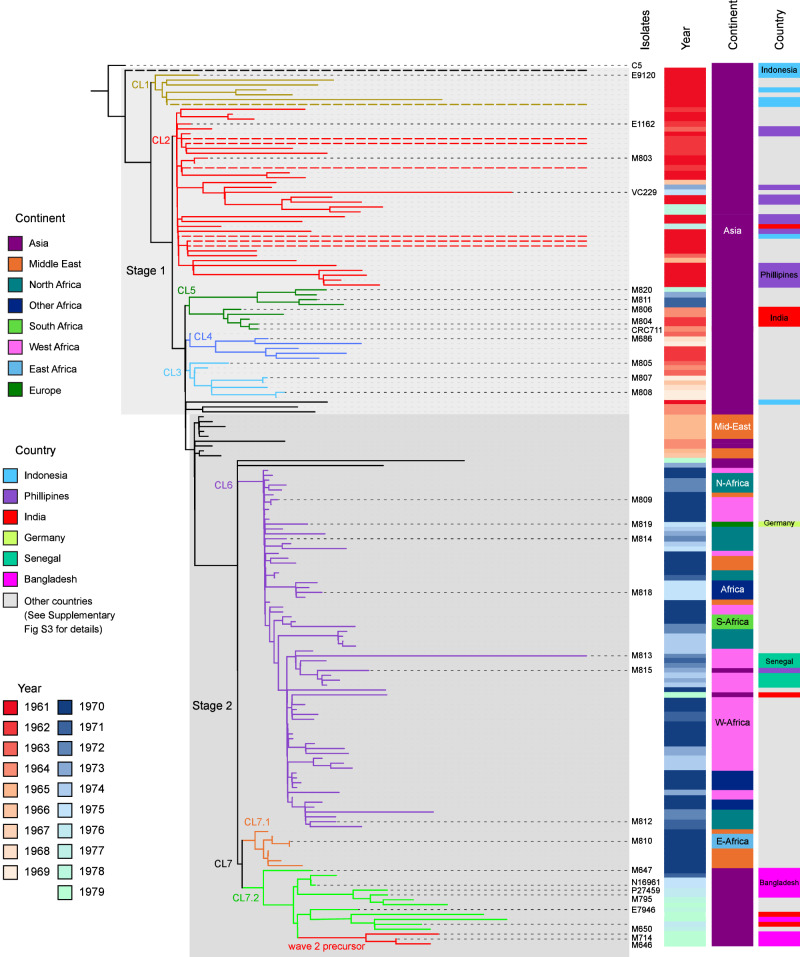
Fig. 2. Maximum-likelihood phylogenetic tree of the early seventh pandemic (1961–1979).
The tree was constructed using 29 complete genomes and 152 Illumina sequenced genomes from the seventh pandemic isolates between 1961 to 1979 and rooted using strain C5 as an outgroup. Stage 1 and Stage 2 were demarcated with light and dark grey shading. Cluster 1 (CL1) to Cluster 7 (CL7) are demarcated with different colour branches and labelled at each node. Dashed branches were shortened for clarity. Year of isolation is shown using a heatmap with reds for 1960s and blues for 1970s. Continent/Subcontinent of origin for each isolate is displayed with a colour bar and country of origin is displayed when that country was mentioned specifically in the text. All other countries were marked in grey colour with country details in Supplementary Fig S3. Only complete genomes are named for clarity. See Supplementary Fig. S3 for full details of isolate names and complete metadata.

