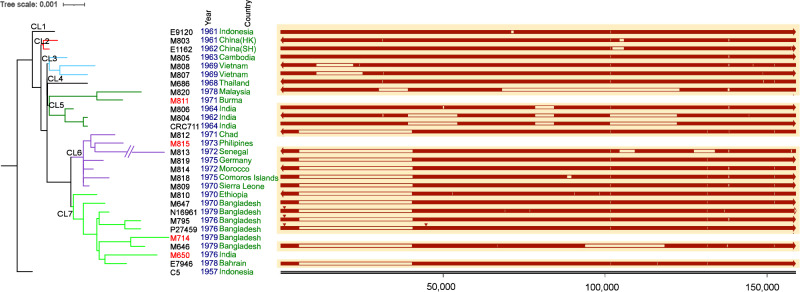
Fig. 4. Alignments of the superintegrons from complete genomes.
Superintegrons (right panel) were extracted from chromosome 2 of each complete genome and aligned against strain C5. The number under the tick marks of the integron size is in base pairs (bp). The empty line segments represent deletions. The red triangles on the top of the segments represent large insertions. The genome sequences of the chromosome 2 of the strains marked in red had not been closed and thus the superintegrons were not presented. The arrows denote the orientation of each aligned sequence. The white arrow denotes the missing bases. Colours for year and country are for visual separation purpose. The tree was the same as that of Fig. 1.

