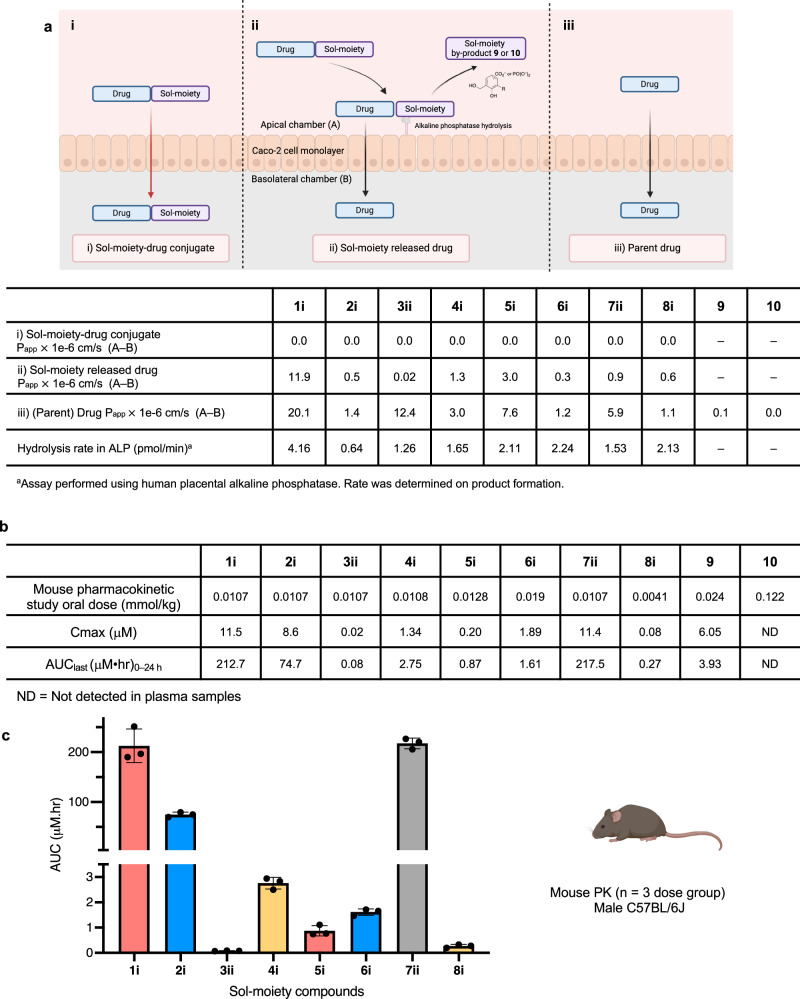
Fig. 4. In vitro ADME and in vivo pharmacokinetic data for Sol-moiety drug-conjugates.
a Comparison of caco−2 experiments to measure i) Permeability of Sol-moiety-drug conjugate; ii) Permeability of the released drug from Sol-moiety; and iii) the permeability of the parent drug (Papp A to B) measured in a separate experiment. The permeability of the Sol-moiety by products 9 and 10 were also measured as well as the hydrolysis rate using human placental alkaline phosphatase. Image created in BioRender. Smith, M. (2024) BioRender.com/x11n290. b Comparison of mouse PK AUC’s of the Sol-moiety drug conjugates 1i, 2i, 3ii, 4i, 5i, 6i, 7ii, 8i and Sol-moiety by-products 9 and 10. Mouse PK experiments were cassette-dosed in saline solution. Appearance of parent drug or Sol-moiety by-product was monitored in mouse plasma with collections at various timepoints over 24 h. c Bar chart to highlight the AUC values for the parent drug following administration of the Sol-moiety drug conjugates 1i, 2i, 3ii, 4i, 5i, 6i, 7ii, and 8i. n = 3 mice per dose group. Data are presented as mean values +/− SD. Mouse image Created in BioRender. Smith, M. (2024) BioRender.com/y69d862.

