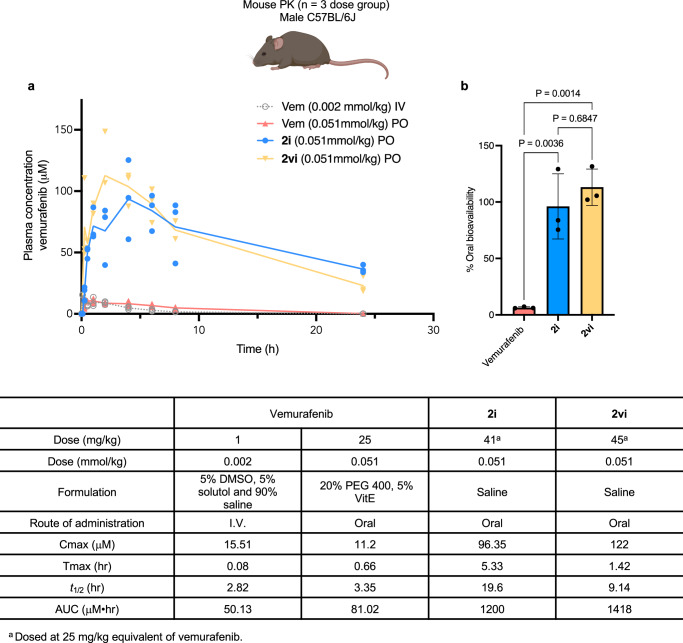
Fig. 7. Comparison of pharmacokinetic profiles of vemurafenib and Sol-vemurafenib 2i and 2vi.
a Plasma concentrations of vemurafenib were measured over 24 h following IV and PO dose of vemurafenib (Vem) in a lipid-based vehicle. Sol-vemurafenib analogs 2i and 2vi were dosed via oral gavage in saline solution. n = 3 mice per dose group. Line data represents mean values at each time point. b Bar chart displaying oral bioavailability of vemurafenib using a 20% PEG 400 based formulation compared to delivery with Sol-vemurafenib 2i and 2vi dosed via oral gavage in saline solution. n = 3 mice per dose group. Data are presented as mean values +/− SD. Statistical significance was determined using an ordinary one-way ANOVA with Tukey’s multiple comparison test. Mouse image Created in BioRender. Smith, M. (2024) BioRender.com/y69d862.

