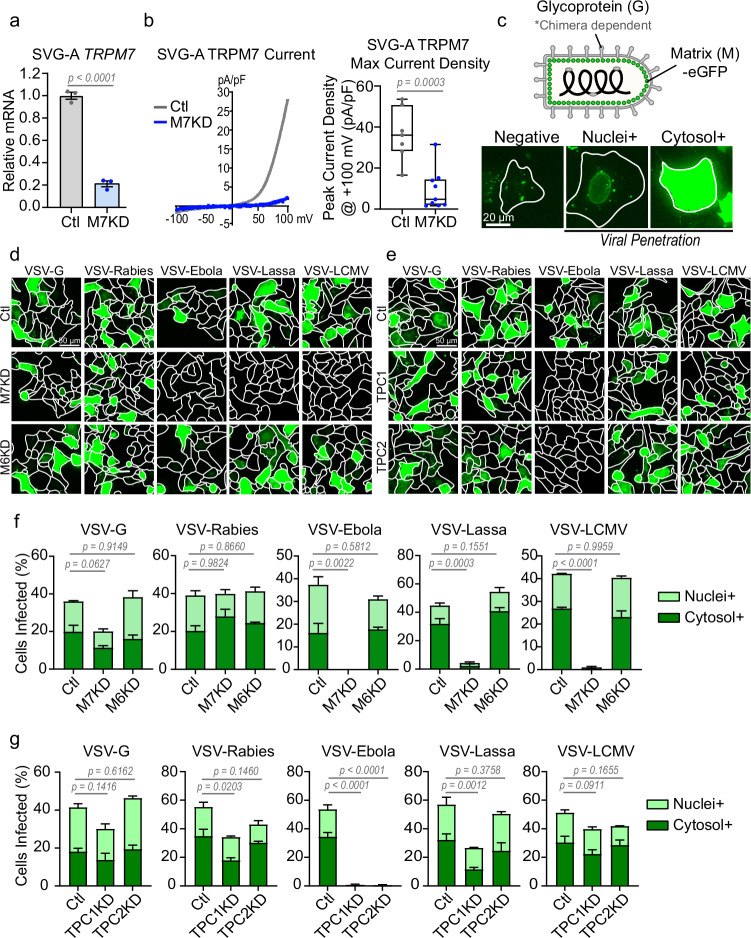
Fig. 1. Loss of TRPM7 broadly inhibits infection by various VSV-chimeras.
a qRT-PCR of TRPM7 in control non-targeting (gray, Ctl) and TRPM7 (blue, M7KD) siRNA treated SVG-A cells from independent transfections. P values determined by two-tailed Student’s t test. Mean, and SEM plotted, n = 3. b (Left) Representative whole-cell patch-clamp recordings shown as current-voltage (IV) relationship. The IVs of Control (gray) and TRPM7 KD (blue) SVG-A cells are overlayed. (Right) A quantitative summary of peak current densities from individual cells at +100 mV is shown (Ctl n = 7, M7KD n = 9 cells). P values determined by two-tailed Student’s t test. Median, 25th, and 75th quartiles are shown with maximum and minimum. c (Top) Schematic of VSV-chimeras used for viral infection assays. Chimeras express the glycoprotein of the indicated viruses. All viruses express MeGFP fusion protein. (Bottom) Viruses that have penetrated the cytosol release MeGFP which subsequently binds to nuclear pores (nuclei+). As viral genomes are translated, MeGFP accumulates in the cytosol (cytosol+). Cytosol+ and nuclei+ are both representative of successful viral escape from the endosomes into the cytosol. Representative images from two independent experiments are shown. d Representative maximum projection fluorescence microscopy images of viral infection (eGFP) in control (Ctl), TRPM7 knockdown (M7KD), and TRPM6 knockdown (M6KD) SVG-A cells. e Representative maximum projection fluorescence microscopy images of viral infection (eGFP) in control (Ctl), TPC1 knockdown (TPC1KD), and TPC2 knockdown (TPC2KD) SVG-A cells. f Quantification of viral penetration in control, M7KD, and M6KD cells by various VSV-chimeras at 6 hours post-infection. Percentage of nuclei+ (light green) and cytosol+ (dark green) cells together represent total virus-infected cells. Mean and SEM plotted of average infection across three independent infections. P values (one-way ANOVA with Tukey’s multiple comparison test) are respective to total viral infection values. g Quantification of virus penetration in control, TPC1KD, and TPC2KD cells by indicated VSV-chimeras at 6 hours post-infection. Percentage of nuclei+ (light green) and cytosol+ (dark green) cells represent total virus-infected cells. Mean and SEM plotted of average infection across three independent infections. P values (one-way ANOVA with Tukey’s multiple comparison test) are respective to total viral infection values.

