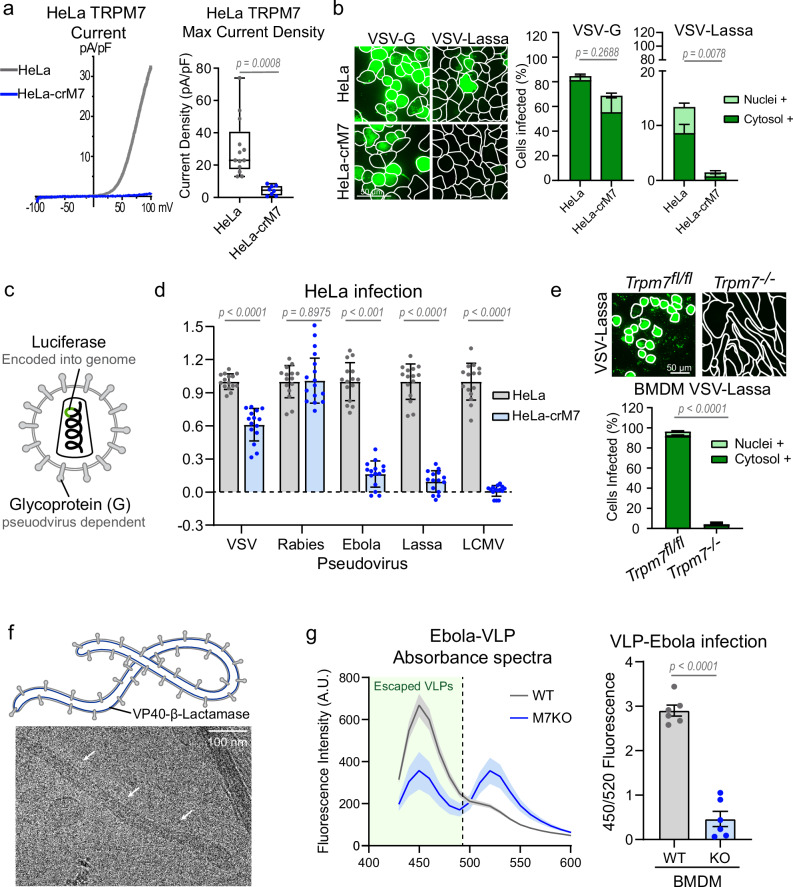
Fig. 2. Loss of TRPM7 protects a variety of cell types from various enveloped viral infections.
a Representative whole cell patch clamp recordings shown as current-voltage (IV) relationship of HeLa (gray) and HeLa-crM7 (blue) wherein Trpm7 was deleted by Crispr-cas9. Quantitative summaries of peak current densities at +100 mV are shown to the right (HeLa n = 13, HeLa-crM7 n = 8). P values determined by two-tailed Student’s t test. Median, 25th, and 75th quartiles are shown, as well as maximum and minimum. b (Left) Representative 20 μm maximum intensity projection of HeLa and HeLa-crM7 cells infected with VSV-G and VSV-Lassa. (Right) Quantification of nuclei+ and cytosol+ infected cells. P values determined by two-tailed Student’s t test of total positive cells. Each experiment is plotted as the average percent infected across multiple fields of view, n = 3. Mean and SEM are plotted. c Schematic of lenti-pseudovirus expressing various enveloped virus glycoproteins. Each pseudovirus genome encodes luciferase. d Relative luciferase luminescence of lenti-pseudovirus infected HeLa cells. Graph shows data points from three independent experiments with five well replicates of HeLa (gray) and HeLa-crM7 (blue). Data points were normalized to average control HeLa luciferase intensity per experiment. P values determined by two-tailed Student’s t test, n = 15. Mean and standard deviation are plotted. e (Left) Representative images of infection Trpm7fl/fl and Trpm7−/− BMDMs with VSV-Lassa. WGA outlines are shown. (Right) Quantification of average percent infected from n = 3 independent experiments. P values determined by two-tailed Student’s t test of total positive cells. Mean and SEM are plotted. f (Top) Schematic of ebola virus-like particle (VLP) expressing membrane-bound VP40 tagged with β-lactamase. (Bottom) Cryo-EM of ebola VLP. White arrows indicate one VLP. The cryo-EM image shown is representative of multiple VLPs observed in two independent sample preparations. g (Left) Spectrum of β-lactamase intensity of WT (gray) and TRPM7 KO (blue) BMDMs at 400 nm excitation. Mean and SEM are plotted. β-lactamase tagged VP40 from cytosolic-penetrated VLPs can cleave CCF-2 AM dye, decreasing FRET 520 nm signal and increasing 450 nm signal. (Right) Average ratio of 450 nm to 520 nm emission is plotted. Two-tailed Student’s t test was used to determine p values. Mean and standard errors are shown. n = 6.

