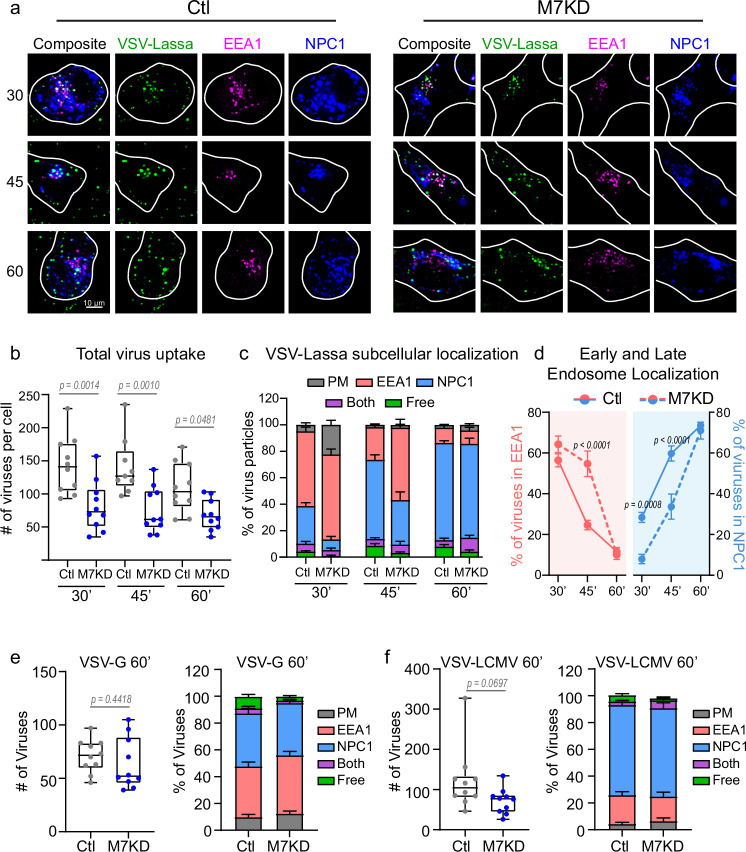
Fig. 3. Viruses traffic through the endosomal maturation pathway in TRPM7 depleted cells.
a Representative images of VSV-Lassa-MeGFP infected Control (Ctl) and TRPM7 knockdown (M7KD) SVG-A cells. Early endosomes are tagged with EEA1-mScarlet (magenta), late endosomes/lysosomes with NPC1-Halo-JFX647 (blue). Cells were incubated with VSV-Lassa-MeGFP for 20 minutes, washed, and imaged at 30-, 45-, and 60-minutes post-infection. Maximum projection of 1.08 μm is shown. b Box and whisker plot of total number of virus particles detected per cell at each time point in Control (gray) and M7KD (blue) cells at 30-, 45-, and 60-minutes post-infection. Median, quartiles, maximum, and minimum are shown. P values determined by two-way ANOVA with Sidak multiple comparisons test. For control-treated cells at 30, 45, and 60 minutes, N = 10, 9, 10. For all M7KD timepoints, N = 10. Same cells are used for analysis in (c, d). c Average percent of viruses localizing to the cell surface (gray), early endosome (red, EEA1), late endosome (blue, NPC1), or free in cytosol (green) per cell at 30-, 45-, and 60-minutes post-infection. Some viruses localized to endosomes that were EEA1+ and NPC1+ (both, purple). Mean and SEM plotted. d Average percent of viruses per cell in early (red) and late (blue) endosomes. Control cells are represented by solid lines, while M7KD cells are represented with dashed lines. Mean and SEM are shown. P values determined by two-way ANOVA with Sidak multiple comparisons test. e (Left) Box and whisker plot of VSV-G particle uptake at 60 minutes post-infection in Control (gray) and M7KD (blue) cells. Median, quartiles, maximum, and minimum are shown. P values determined by two-tailed Student’s t test. (Right) Subcellular localization in Control and M7KD SVG-A cells at 60 minutes post-infection. n = 10 cells per condition. Mean and SEM plotted. f (Left) Box and whisker plot of total VSV-LCMV viral uptake at 60 minutes post-infection in Control (gray) and M7KD (blue) cells. Median, quartiles, maximum, and minimum are shown. P values determined by two-tailed Student’s t test. (Right) Subcellular localization in Control and M7KD SVG-A cells at 60 minutes post-infection. n = 10 cells per condition. Mean and SEM plotted.

