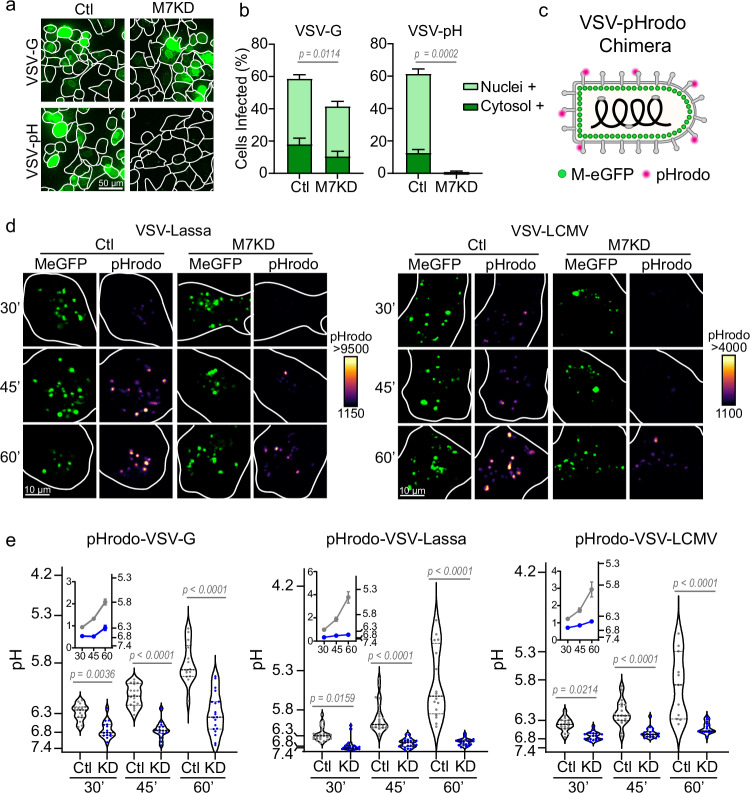
Fig. 4. TRPM7 regulates viral endosome acidification.
a Representative maximum projections of Control (Ctl) and TRPM7 knockdown (M7KD) SVG-A cells infected by parental VSV-G or the VSV pH-sensitive mutant, VSV-V269H. Cells were fixed 6 hours post-infection. b Quantification of VSV-G and VSV-pH sensitive mutant infection. Percent of Nuclei+ cells are shown in light green and Cytosol+ cells in dark green. P values determined from two-tailed Student’s t test of total positive cells from three independent infection assays. Mean and SEM are plotted. c Schematic of pHrodo-tagged VSV-chimera viruses expressing MeGFP. d Representative images of MeGFP and pHrodo signal time course in Ctl and M7KD SVG-A cells. VSV-Lassa-MeGFP or VSV-LCMV-MeGFP is shown in green. pHrodo signal is shown pseudo-colored based on the intensity spectrum, with black/purple being the lower intensity and yellow being the highest intensity. Images are 2.43 μm maximum projections. e Single particle quantification of the viral endosome pH at 30-, 45-, and 60 minutes following virus incubation. Control (Ctl) cells are shown in gray and TRPM7 knockdown (KD) cells in blue. Each data point represents the average pH of all virus particles detected across a single cell. Violin plots display median (thick dotted line) as well as 25th and 75th quartiles (thin dotted lines). P values are determined by two-way ANOVA with Sidak multiple comparisons test. Inset graphs show mean pH per cell over time with SEM. At 30, 45, and 60 minutes VSV N = 15, 18, 14; Lassa N = 25, 22; 16; LCMV N = 17, 19, 11 for control cells and VSV N = 15, 15, 19; Lassa N = 24, 23, 20; LCMV N = 19, 20, 18 for M7KD cells.

