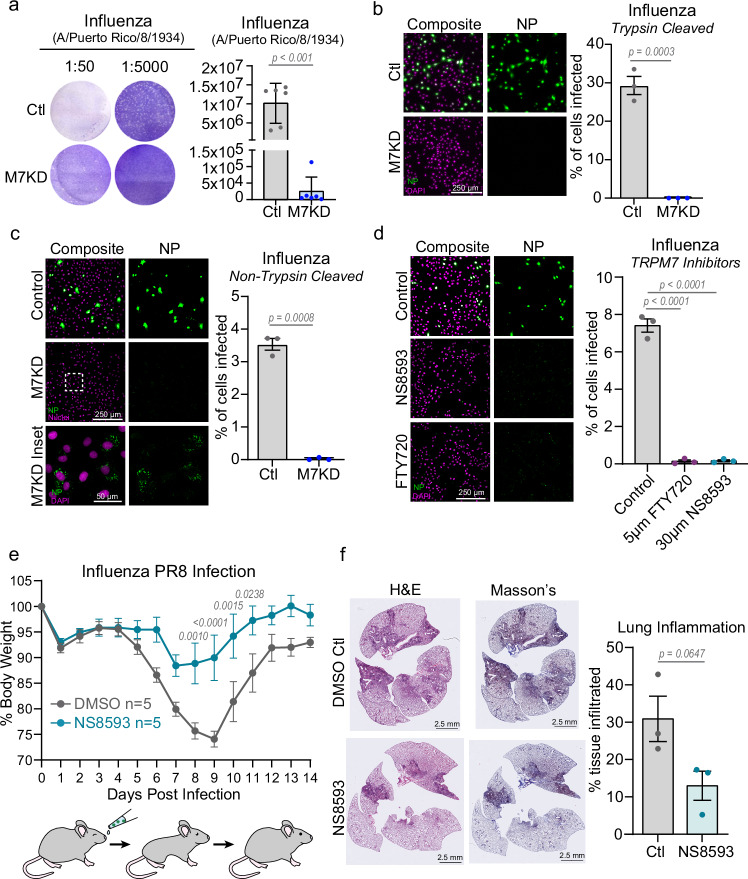
Fig. 8. Inhibition of TRPM7 ion channel activity protects from Influenza infection in vitro and in vivo.
a Plaque assay of Influenza A/Puerto Rico/8/1934 at two different dilutions. Viruses were propagated in Control (Ctl, gray) or TRPM7 knockdown (M7KD, blue) cells, and plaque assays were performed with parental Vero cells. P values determined by two-tailed Student’s t test. n = 6 independent plaque assays. Mean and standard deviation are plotted. b (Left) First round trypsin-cleaved influenza infection in control and M7KD Vero cells stained for influenza nucleoprotein (NP, green). Individual cells are identified by DAPI staining (Magenta). (Right) Quantification of percent cells infected in Ctl and M7KD vero cells. P values determined by two-tailed Student’s t test. n = 3 independent experiments. Mean and SEM plotted. c (Left) Maximum projection of first round non-trypsin-cleaved influenza infection in control and M7KD Vero cells stained for influenza nucleoprotein. Inset shows viral nucleoprotein retained in intracellular compartments after 8-hour incubation. (Right) Quantification of infection in Ctl and M7KD Vero cells with p values determined by two-tailed Student’s t test. n = 3 independent experiments. Mean and SEM plotted. d (Left) Representative maximum projection images of non-trypsin cleaved influenza infection in Vero cells treated with 5 µM FTY720 or 30 µM NS8593. (Right) Quantification of infection in Vero cells treated with FTY720 or NS8593. P values determined by one-way ANOVA with Tukey’s multiple comparison test. n = 3 independent experiments. Mean and SEM plotted. e Weight of mice treated with 150 Plaque Forming Units (PFU) of Influenza A/Puerto Rico/8/1934. Control (DMSO) mice are shown in gray, and NS8593 treated mice in teal. Virus was nasally administered in 40 µL of PBS containing DMSO or 250 µM NS8593. P values determined by Repeated Measures two-way ANOVA with Sidak multiple comparisons test. f (Left) Histology of lungs from mice treated with Influenza +/− NS8593. Hematoxylin and eosin (H&E) stain as well as Mason’s trichrome stain are shown. (Right) Quantification of tissue area with immune infiltration from H&E staining in Control and NS8593 murine lungs. P values determined by two-tailed Student’s t test. n = 3 lungs from individual mice. Mean and standard deviation are plotted.

