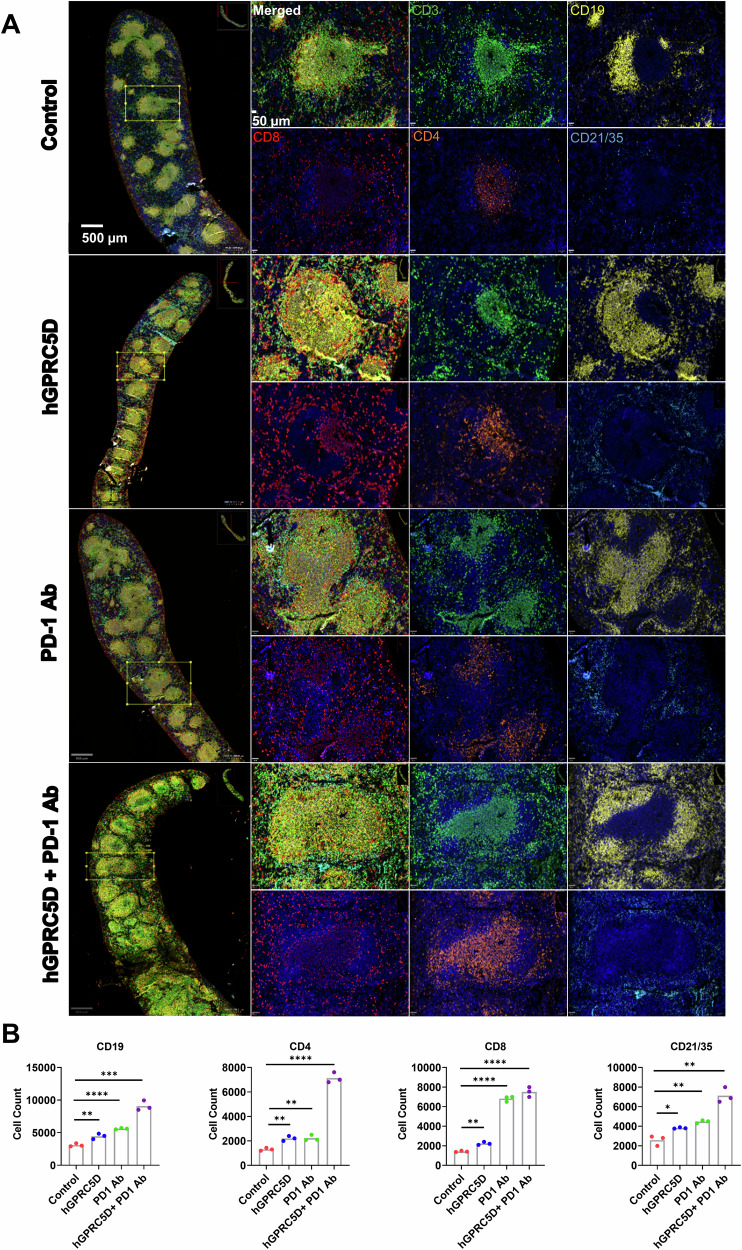
Fig. 7. Evaluation of the altered immune cell populations in the spleen of immunized mice using mIF analysis.
A Composite image of spleen sections (Scale bar = 500 µm) and germinal center (Scale bar = 50 µm) from immunized mice models followed by an image for each marker. Markers for CD3, CD19, CD8, CD4, and CD21/35 are in green, yellow, red, orange, and blue, respectively. The images were analyzed using the using the open-source software QUPATHv.4.4-m4. B Graphs illustrating the immune cell populations in the spleen sections.

