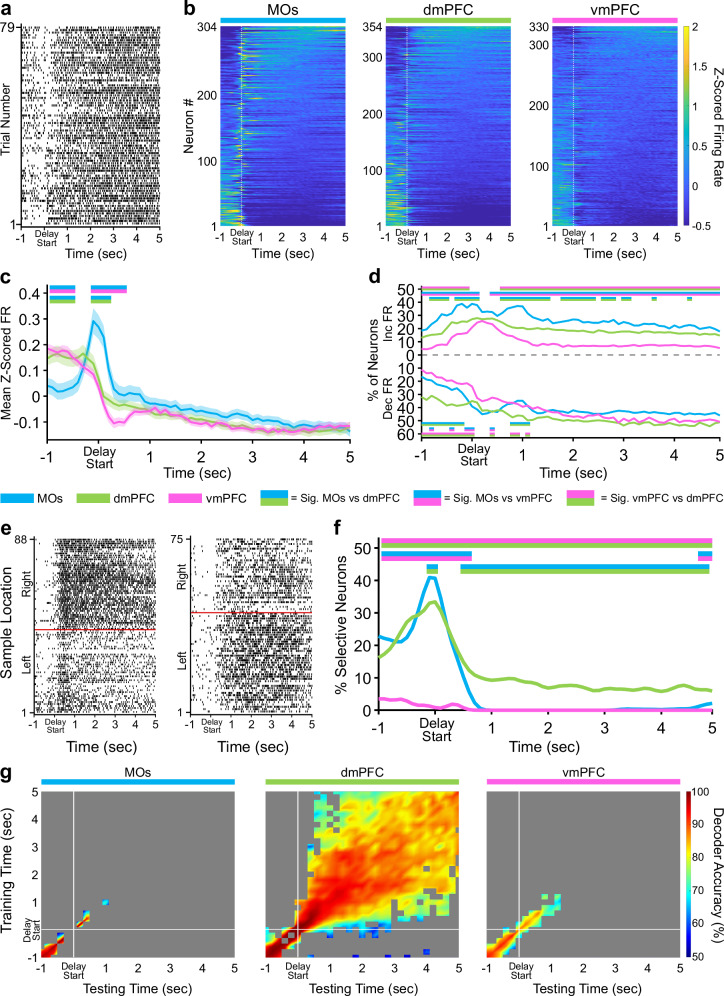
Fig. 3. Delay activity in dorsal mPFC is persistently selective for retrospective sample location.
a Example raster plot from a dmPFC neuron aligned to the start of the delay hold period for all correct trials. b Z-scored heat maps of all neurons recorded from each region, sorted by each neuron’s mean Z-scored firing rate during the delay phase (5 s period after the white dashed line). c The mean Z-scored pseudopopulation firing rate is higher in MOs around the delay poke compared to the other regions. Lighter shaded areas above and below the solid lines represent the standard error of the mean at each time point. d The percentage of neurons significantly increasing or decreasing their firing rate from baseline (ITI) is also higher in the MOs at delay start. e Example sample location-sorted raster plots of two dmPFC neurons exhibiting persistent selective firing for retrospective right or left sample location throughout the delay phase. Red line separates left from right sample trials. f MOs and dmPFC contain similar percentages of neurons selective for either retrospective sample location (Left and Right combined) in a ~1 s window around the delay poke, but only the dmPFC shows persistent sample location selectivity throughout the entire delay phase. g Sample location decoding using a linear support vector machine that was trained and tested on every combination of 200 ms time bins during the delay phase confirms the existence of persistent selectivity only in the dmPFC. White lines indicate the start of the delay period (back port poke). Grey area represents non-significant decoder accuracy compared to a trial identity-shuffled control. In panels c, d, and f, double-colored straight lines represent statistically significant differences (p-value < .05) between the two respective subregions in that time bin, after correcting for both false discovery rate and family-wise error rate.

