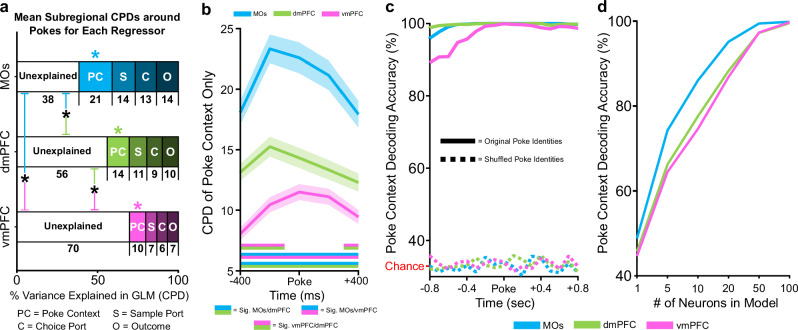
Fig. 5. DNMTP task variables account for the most poke-related firing rate variability in MOs.
a The coefficient of partial determination (CPD, calculated for each neuron) from a general linear encoding model was used to estimate the proportion of total pseudopopulation firing rate variance around pokes that was either unexplained (white bars) or that could be explained by our four regressors (Poke Context, Sample Port, Choice Port, and Outcome). Numbers under each regressor represent the mean CPD (% variance explained) across five 200 ms time bins around the poke for that regressor (this time frame can be visualized in the following panel, 5b). A one-way ANOVA revealed a significant main effect of subregion on explainable variance, F(2, 985) = 44.54, p = 3.02e-19. Bonferroni post-hoc comparisons found that the MOs had the most explainable variance among subregions, while vmPFC contained the least (black asterisks, MOs vs. dmPFC p = 3.02e-7, MOs vs vmPFC p = 8.78e-20, dmPFC vs vmPFC, p = 5.35e-5). Furthermore, in each subregion, one-way ANOVAs with Bonferroni post-hoc tests found that of the four regressors, Poke Context (PC) was the largest contributor to explained variability. Colored asterisks represent significant differences within subregions between the CPD values for Poke Context and all three other regressors. b Looking at the CPD of Poke Context in isolation at all time points around the poke, we confirm that this regressor accounts for significantly more firing rate variability in the MOs at all time points around pokes, followed by dmPFC and then vmPFC. Double-colored straight lines represent statistically significant differences (p-value < .05) between the two respective subregions in that time bin, after correcting for both false discovery rate and family-wise error rate (see Methods). Lighter shaded areas above and below the solid lines represent the standard error of the mean CPD from the pseudopopulation at each time point. c Despite MOs containing the highest CPD for Poke Context, Poke Context is decodable with nearly 100% accuracy in all regions around pokes using a linear support vector machine. Chance level decoding in the shuffled control (dashed lines) is 1/3. d Subsampled SVMs revealed that the MOs can decode Poke Context with fewer cells than the other subregions.

