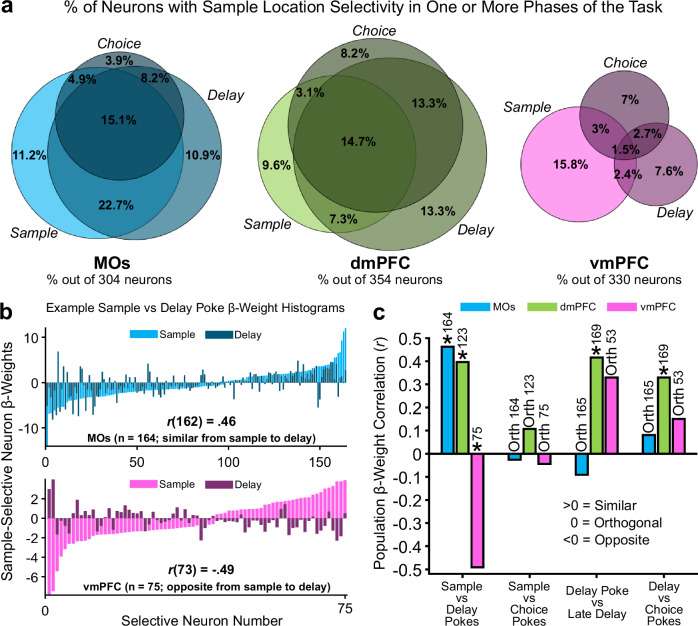
Fig. 7. Sample-location-selective firing rate representations have higher stability in MOs and dmPFC compared to vmPFC as mice progress through working memory task phases.
a Venn diagrams depicting the percent of the total pseudopopulation in each region that was selective for the sample location around the poke initiating each task phase. Overlapping circles in the Venn diagram represent the percent of neurons that share retrospective sample location selectivity around either two or all three task phase pokes. b Example GLM-derived beta-weight histograms from significant sample location-encoding neurons in the GLM showing how most neurons in the MOs remain selective for the same port across sample and delay pokes (top), but neurons in the vmPFC switch initial sample location selectivity from sample to delay (bottom). c Pearson beta-weight correlations quantifying the similarity in location selectivity between pokes initiating one task phase, to pokes initiating another one. MOs location selectivity is similar from sample to delay pokes, but destabilizes over the course of the task. dmPFC remains the most stable across time. vmPFC shifts location selectivity from the sample to delay pokes, but then stabilizes later in the task. Asterisks represent an r value that is significantly different from zero, while Orth (Orthogonal) represents an r value that is not significantly different from zero. The reason for the non-significant r value from the vmPFC correlation in the Delay Poke vs Late Delay condition is because of the much smaller number of selective neurons in vmPFC during this time. Numbers above each bar indicate the count of significantly selective neurons in each region used for the correlation.

