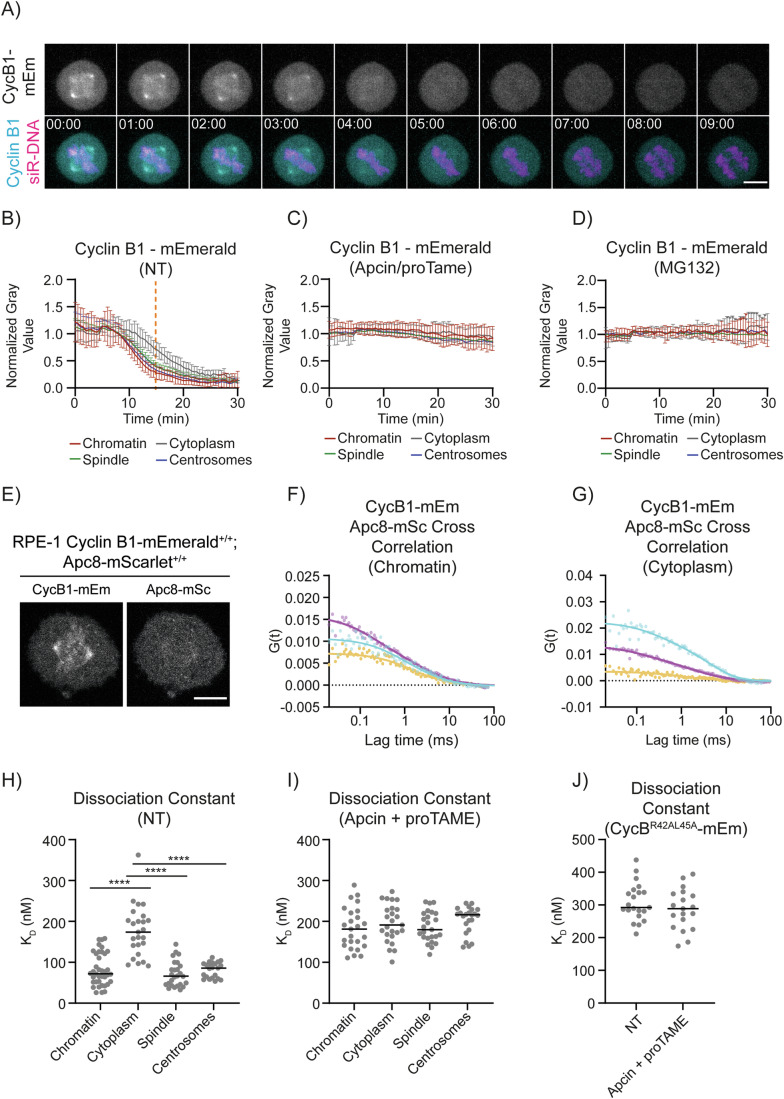
Figure 1. Cyclin B1 degradation is spatially regulated.
(A) Representative maximum projections of fluorescence confocal images over time of an RPE-1 Cyclin B1-mEmerald+/+ cell progressing through mitosis. Time is expressed as mm:ss. The scale bar corresponds to 10 μm. (B–D) Quantification of Cyclin B1 fluorescence levels (normalised raw integrated density, RID) over time in RPE-1 Cyclin B1-mEmerald+/+ cells: n ≥ 18 cells per condition, N = 3 independent experiments. Mean ± standard deviation are plotted. (E) Representative fluorescence confocal images of RPE-1 Cyclin B1-mEmerald+/+; APC8-mScarlet+/+ cells. The scale bar corresponds to 10 μm. (F, G) Representative graph of the autocorrelation of Cyclin B1-mEmerald and APC8-mScarlet and the cross-correlation between the two at the chromatin (F) and in the cytoplasm (G). In this and all following FCCS graphs, dots = data, lines = fit; Cyan = Cyclin B1-mEmerald, magenta = APC8-mScarlet, yellow = cross-correlation between cyclin B1-mEmerald and APC8-mScarlet. (H–J) Dot plots representing the KD between endogenous Cyclin B1-mEmerald and APC8-mScarlet in the indicated conditions: n ≥ 21 cells per condition, N = 3 independent experiments. In this and all following KD dot plots, each dot corresponds to a single measurement, horizontal black lines represent median values. In this and all following figures, the orange dotted line indicates anaphase (panel B), the dotted horizontal line indicates 0 (panels F, G), CycB1 Cyclin B1, mEm mEmerald, mSc mScarlet, see Appendix Table S2 for statistical tests and p values. ns not significant, p > 0.05; ∗p < 0.05, ∗∗p < 0.01, ∗∗∗p < 0.001, ∗∗∗∗p < 0.0001 for all figures. Source data are available online for this figure.

