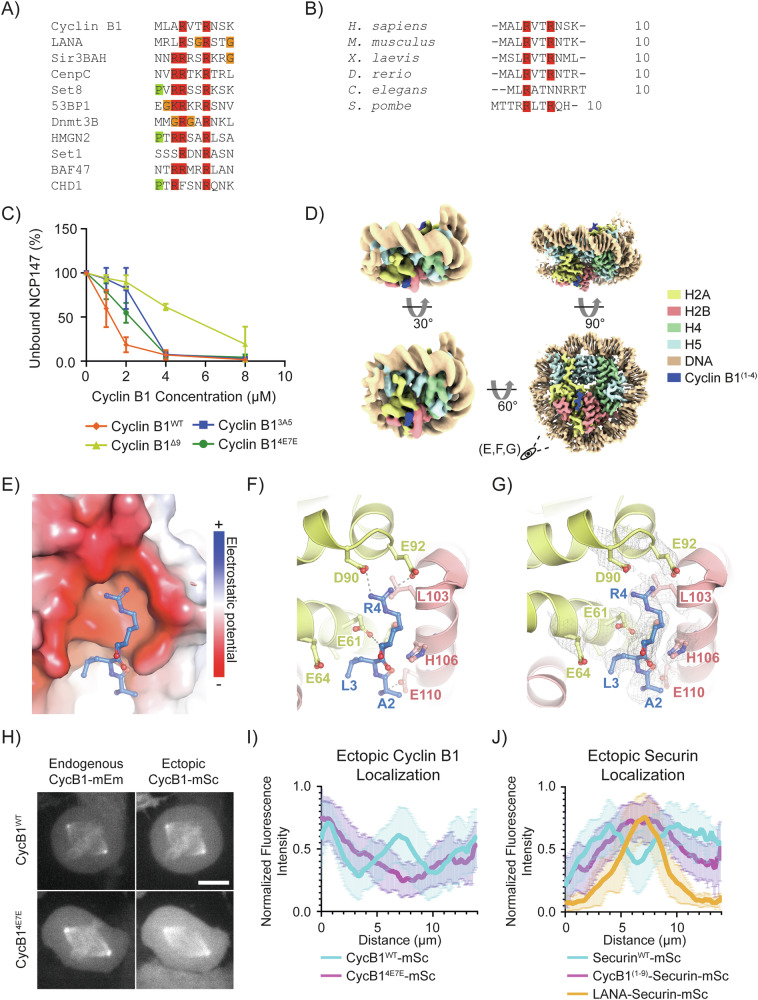
Figure 4. Cyclin B1 N-terminus mediates nucleosome binding.
(A) Protein alignment of the N-terminus of human Cyclin B1 with known arginine anchors of other nucleosome interacting proteins. (B) Protein alignment of the N-terminus of Cyclin B1 orthologues. (C) Quantification of EMSAs of full-length Cyclin B1WT and the indicated Cyclin B1 variants. N = 3 independent experiments. Mean ± standard deviation are plotted. (D) Cryo-EM structure of the NCP in complex with Cyclin B N-terminus (NCPCbNT). On the left, the cryo-EM density is low-pass filtered to 7 Å to show the nucleosome particle in its entirety (including the less rigid entry and exit DNA). On the right, the same structure is shown at full power (2.5 Å resolution). (E) A close-up view of D, residues 2–4 of Cyclin B1 interact with the acidic patch of NCP147. Cyclin B1 is shown as a ball and stick, histones H2A and H2B are shown as electrostatic surface potentials (−/+5.000). (F) Same structure as in (E), however, H2A and H2B histones are shown as ribbon models. Interacting side chains are depicted. Dashed lines indicate hydrogen bonds between R4 of Cyclin B1 and acidic patch residues D90 and E92. Cyclin B1 peptide backbone at A2 interacts with E110 of H2B. (G) Cryo-EM density on the side chains shown in (F). (H) Maximum projections of confocal images representative of RPE-1 Cyclin B1-mEmerald+/+ cells ectopically expressing the indicated variant of Cyclin B1-mScarlet. The scale bar represents 10 μm. (I) Line-profile graph representing the pixel-by-pixel fluorescence intensity over a line drawn from centrosome to centrosome of RPE-1 Cyclin B1-mEmerald+/+ cells ectopically expressing the indicated Cyclin B1 variant: n = 18 cells per condition, N = 3 independent experiments. Mean ± standard deviation are plotted. (J) Line-profile graph representing the pixel-by-pixel fluorescence intensity over a line drawn from centrosome to centrosome of RPE-1 Cyclin B1-mEmerald+/+ cells ectopically expressing the indicated Securin variant: n ≥ 16 cells per condition, N = 3 independent experiments. Mean ± standard deviation are plotted. Source data are available online for this figure.

