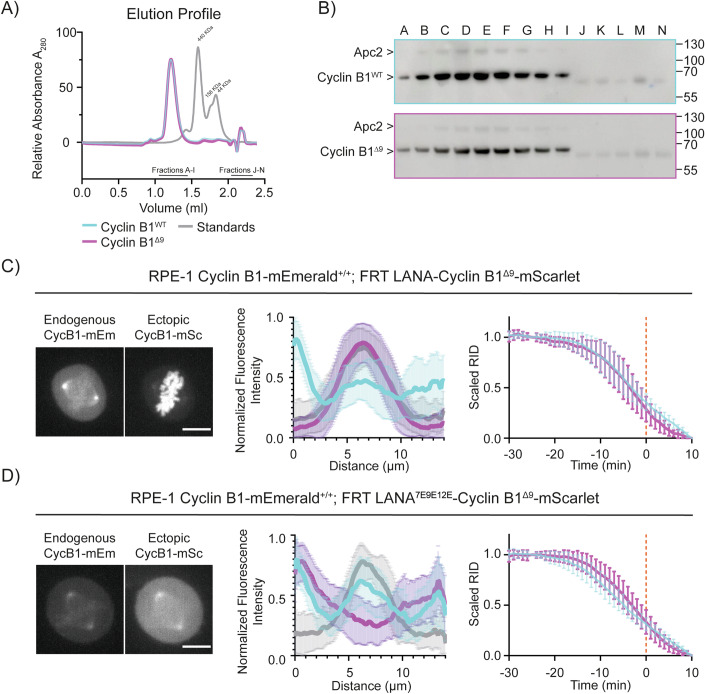
Figure 6. Restoring Cyclin B1Δ9 chromatin localisation rescues its degradation timing.
(A) The elution profile of APC/CCDC20 with Cyclin B1WT (cyan) or Cyclin B1Δ9 (magenta) on size-exclusion chromatography. Graph representative of N = 3 independent experiments. (B) Representative immunoblot of the size-exclusion chromatography is shown in (A). (C, D) Left: Maximum projections of confocal images representative of RPE-1 Cyclin B1-mEmerald+/+ cells ectopically expressing the indicated variant of Cyclin B1-mScarlet. The scale bar corresponds to 10 μm. Middle: Graphs representing the pixel-by-pixel fluorescence intensity over a line going from centrosome to centrosome of RPE-1 Cyclin B1-mEmerald+/+ (Cyan) cells ectopically expressing the indicated variant of Cyclin B1-mScarlet (Magenta). Grey indicates siR-DNA staining: n ≥ 38 cells per condition, N ≥ 3 independent experiments. Mean ± standard deviation are plotted. Right: Cyclin B1 degradation graph representing the fluorescence intensity of Cyclin B1 over time of RPE-1 Cyclin B1-mEmerald+/+ (Cyan) cells ectopically expressing the indicated variant of Cyclin B1-mScarlet (Magenta): n ≥ 15 cells per condition, N ≥ 3 independent experiments. Mean ± standard deviation are plotted. Source data are available online for this figure.

