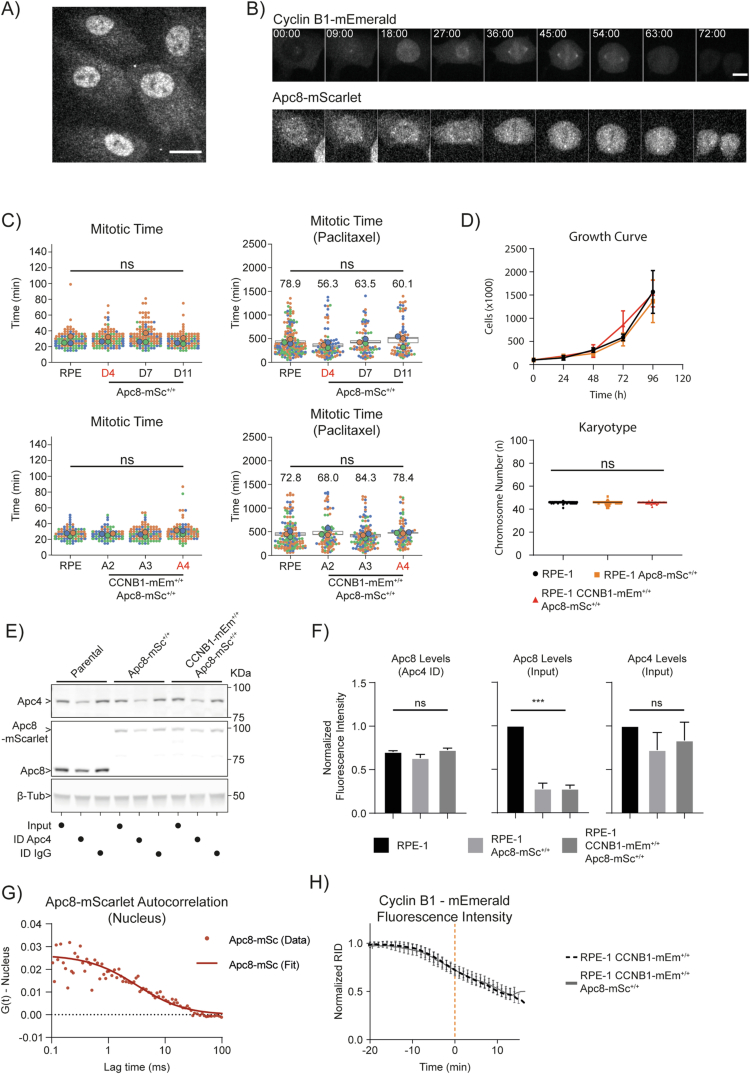
Figure EV1. Characterisation of RPE-1 CyclinB1-mEmerald+/+ and APC8-mScarlet+/+ cells.
(A) Representative fluorescence confocal image of RPE-1 CyclinB1-mEmerald+/+; APC8+/+ cells in interphase. The scale bar corresponds to 20 μm. (B) Representative fluorescence confocal images over time of a CyclinB1-mEmerald+/+; APC8+/+ cell progressing through mitosis. Time is expressed as mm:ss. The scale bar corresponds to 10 μm. (C) Dot plots of the mitotic timing of parental RPE-1, RPE-1 APC8-mScarlet+/+, RPE-1 CyclinB1-mEmerald+/+ and APC8-mScarlet+/+ cells, untreated (left) or treated with 100 nM paclitaxel (right). Each small dot represents one cell and large dots represent the median of independent experiments: n ≥ 83 cells per condition, N = 3 independent experiments. Numbers on the graphs indicate the percentage of cells completing mitosis during the time of observation. Clones marked in red are the ones selected for all following experiments. (D) Top, growth curve of RPE-1 (black), RPE-1 APC8-mScarlet+/+(orange), RPE-1 CyclinB1-mEmerald+/+ and APC8-mScarlet+/+(red), N = 3 experiment. Mean ± standard deviation are plotted. Bottom, dot plot of the chromosome number of parental RPE-1, RPE-1 APC8-mScarlet+/+, RPE-1 CyclinB1-mEmerald+/+ and APC8-mScarlet+/+ cells. Each dot represents one chromosome spread: n ≥ 34 spreads per condition, N = 2. (E) Representative anti-APC8, anti-APC4 and β-Tubulin immunoblot of cell lysates from parental RPE-1, RPE-1 APC8-mScarlet+/+, RPE-1 CyclinB1-mEmerald+/+ and APC8-mScarlet+/+ cells before and after immunodepleting APC4, compared with control immunodepletion with IgG. (F) Bar graphs representing the quantification of the immunoblot in (panel E). N = 2 independent experiments. Mean ± standard deviation are plotted. (G) Graph representing the autocorrelation function of APC8-mScarlet over time in the nucleus. (H) Quantification of normalised Cyclin B1 fluorescence levels over time measured by spinning-disk fluorescence microscopy in RPE-1 CyclinB1-mEmerald+/+ cells compared to RPE-1 CyclinB1-mEmerald+/+; RPE-1 APC8-mScarlet+/+, RPE-1 CyclinB1-mEmerald+/+ cells. n ≥ 9 cells per condition, N = 3 independent experiments. Mean ± standard deviation are plotted. Figure EV1 – Supplementary text to determine whether APC8-mScarlet is properly incorporated into the APC/C, we reasoned that immunoprecipitating an APC/C subunit would result in a depletion of APC8 levels in the lysate. Measuring the levels of APC8 immunodepletion following immunoprecipitation of APC4 revealed no significant cgq RPE-1, RPE APC8-mScarlet+/+, and RPE APC8-mScarlet+/+; Cyclin B1-mEmerald+/+ cells, indicating that mScarlet does not interfere with APC8 incorporation into the APC/C.

