
Figure 2. Progression-free Survival and Time to Next Intervention in the Full Analysis Set.
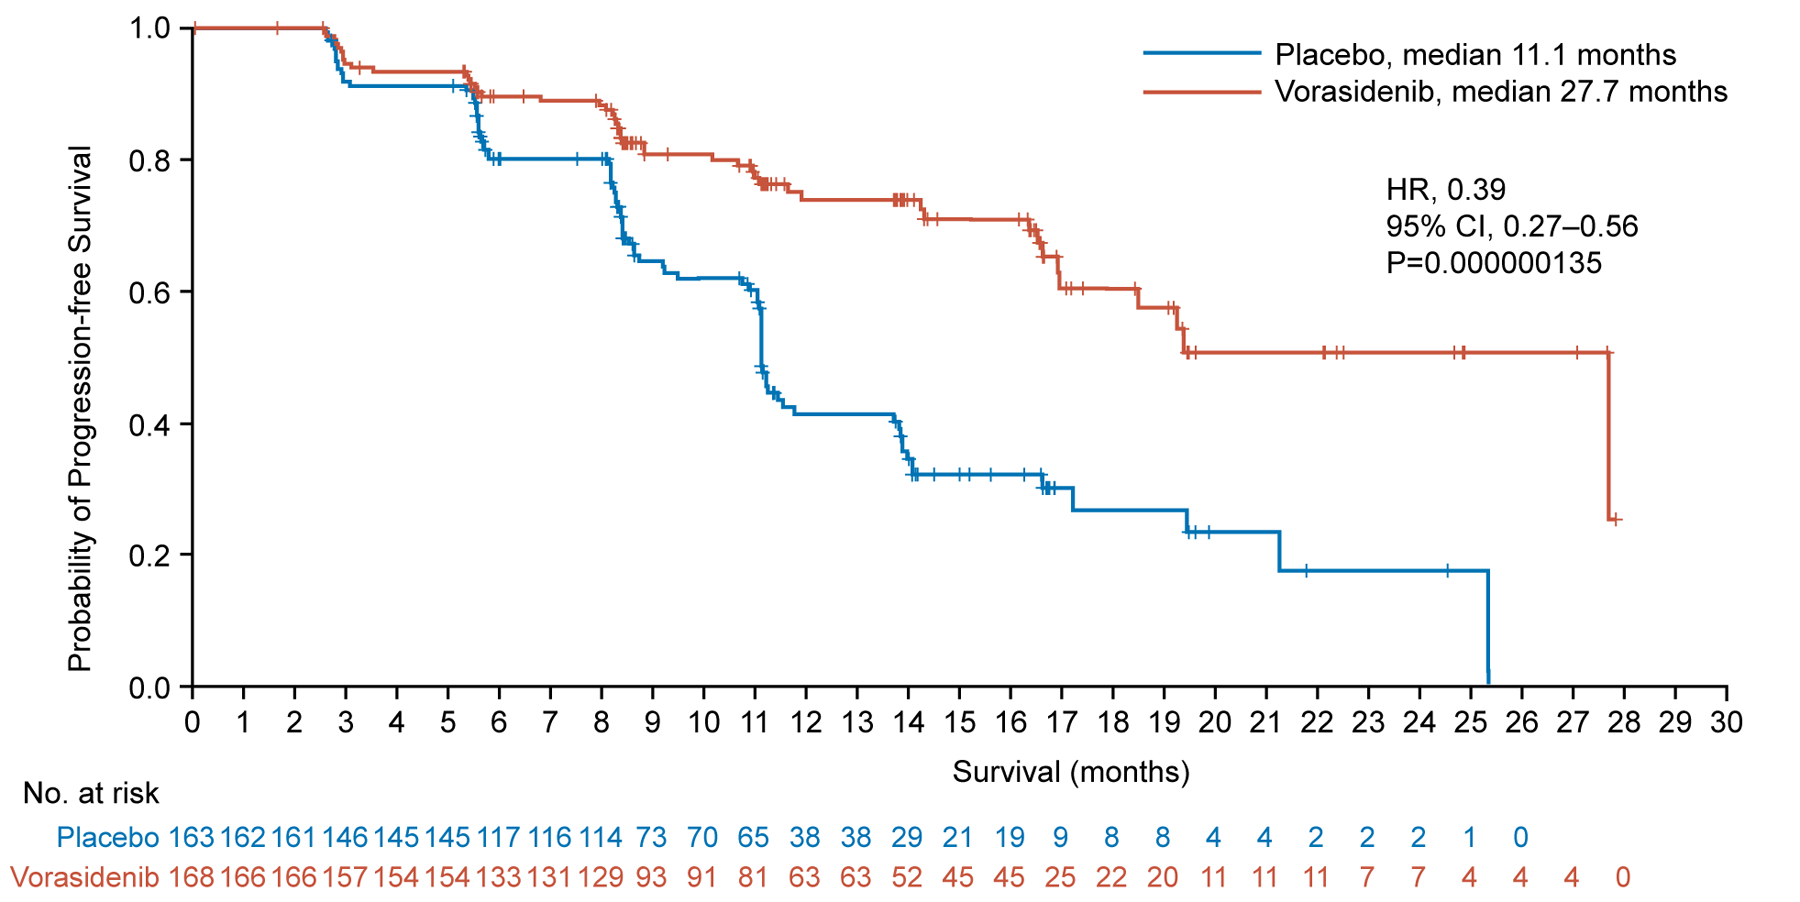
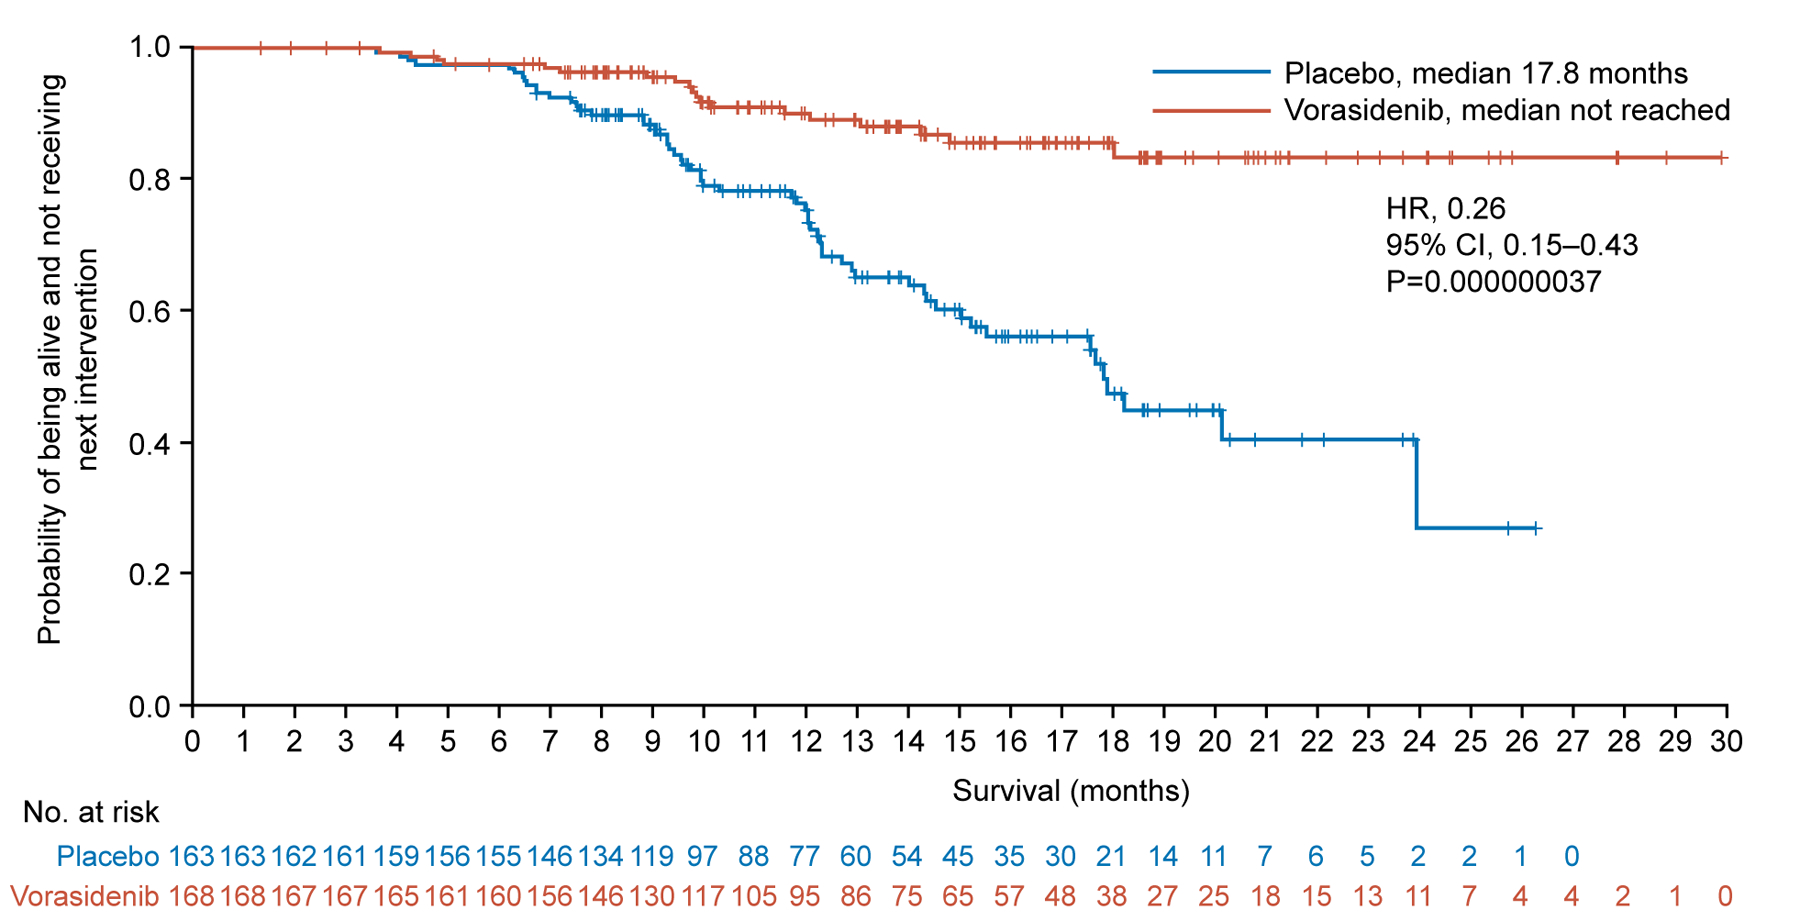
Panel A shows the Kaplan–Meier plot of the probability of imaging-based progression-free survival per blinded independent review among patients assigned to the vorasidenib group as compared with those assigned to the placebo group. Panel B shows the Kaplan–Meier plot of the probability of time to next anticancer treatment intervention among patients assigned to the vorasidenib group as compared with those assigned to the placebo group.
+Censored
CI confidence interval; HR hazard ratio.