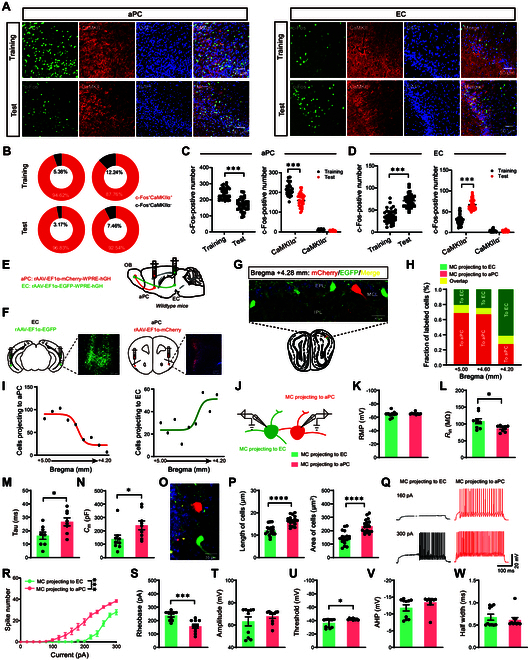
Fig. 2.

Anatomical distribution and specific electrophysiological characteristics of OBM/T projections to the aPC and EC. (A) Representative confocal image of c-Fos (green) and CaMKIIα (red) in the aPC and EC during the olfactory-related working memory test. aPC, anterior piriform cortex; EC, entorhinal cortex. Green, c-Fos; red, CaMKIIα. Scale bars, 50 μm. (B) Pie chart of coexpression of c-Fos+, CaMKIIα+, and DAPI for (A). (C and D) Quantification of coexpression of c-Fos+ with DAPI (left) or with CaMKIIα+ (right) after the training or test session in the aPC (C) or EC (D) (n = 6 in each group, and 2 views of slices were provided for each mouse). (E and F) Schematic (E) and histology (F) of rAAV2/9-EF1α-mCherry-EGFP-hGHpA injection into the aPC and rAAV2/9-EF1α-EGFP-WPRE-hGHpA injection into the aPC and EC. (G) Representative image of coronary brain sections of mitral/tufted (M/T) cells in C57 mice after rAAV2/9-EF1α-mCherry-EGFP-hGHpA injection into the aPC and rAAV2/9-EF1α-EGFP-WPRE-hGHpA injection into the EC. (H) Fraction of mCherry+ (red), EGFP+ (green), and dually labeled (yellow) neurons in the OB as a function of bregma. (I) Distribution of OB-aPC (mCherry+) and OB-EC (EGFP+) M/T cells in the ipsilateral OB from bregma +5.00 mm to +4.20 mm. (J) rAAV-EF1α-mCherry-WPRE-hGH and rAAV-EF1α-EGFP-WPRE-hGH were injected in the aPC and EC, respectively, and whole-cell recordings were performed in mCherry+ or EGFP+ M/T cells in the OB. (K to N) Quantification of the intrinsic membrane properties in mCherry+ (n = 9 cells from 3 mice) or EGFP+ M/T cells (n = 10 cells from 3 mice). Resting membrane potential (RMP) (K), Rin (L), Tau (M), Cm (N). (O) Representative image of coronary brain sections of M/T cells in C57 mice after rAAV2/9-EF1α- mCherry-EGFP- hGHpA injection into the aPC and rAAV2/9-EF1α-EGFP-WPRE-hGHpA injection into the EC. (P) Quantification of the length and area of EGFP+ M/T cells or mCherry+ M/T cells (n = 19 cells from 3 mice). (Q) Representative AP firing of EGFP+ M/T cells and mCherry+ M/T cells evoked by current injections from 0 to 300 pA (stepped by 20 pA). (R and S) Quantification of the AP frequency (R) and current threshold of AP (S) of EGFP+ M/T cells and mCherry+ M/T cells evoked by current injections from 0 to 300 pA (stepped by 20 pA). (T to W) Quantification of the AP properties in EGFP+ M/T cells (n = 10 cells from 3 mice) or mCherry+ M/T cells (n = 9 cells from 3 mice). Black column, EGFP+ M/T cells; red column, mCherry+ M/T cells. AP amplitude (T), AP firing threshold (U), AP half-width (V), AP after-hyperpolarization (W) (n = 5 mice, unpaired 2-sample Student’s t test). Data are presented as mean ± SEM; *P < 0.05, ***P < 0.001, ****P < 0.0001. Two-way ANOVA for (C) (right), (D) (right), and (R). Unpaired 2-tailed Student’s t test for (C) (left), (D) (left), (K) to (N), (P), and (S) to (W).
