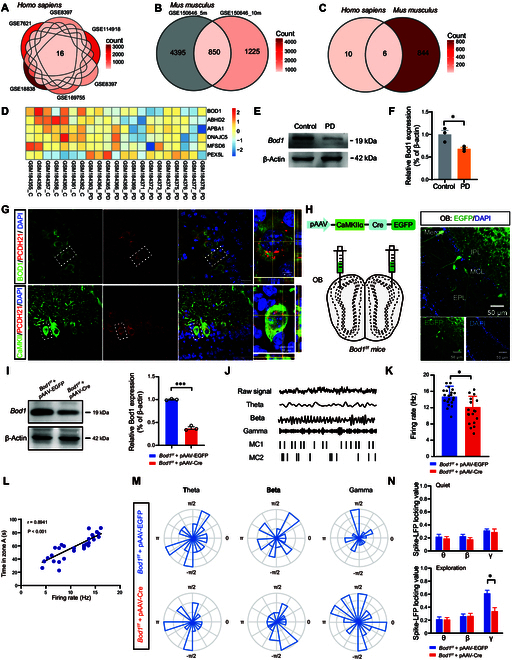
Fig. 5.

Bod1 deficiency induces decreased M/T cell activity. (A to C) Overlapping Venn diagram of differentially expressed (DE) transcriptomic genes in 6 candidate gene databases of PD patients and 2 candidate gene databases of PD model mice. (D) Heatmap of changes in expression of 6 overlapping DE genes. (E and F) Representative band (E) and quantification (F) of BOD1 protein in the OB of PD mice (n = 3 in each group). (G) Representative images of immunofluorescence of BOD1, PCDH21, and CaMKIIα in the mitral cell layer (MCL) of the OB. DAPI mark for nucleus. Scale bars, 50 μm. (H) Schematic illustration of AAV-CaMKIIα-GFP-Cre injection into the mitral cell layer of Bod1f/f mice (left) and representative images of EGFP+ cells in the MCL of the OB after the injection of AAV-CaMKIIα-Cre-EGFP (right). Scale bars, 50 μm. (I) Representative band and quantification of Bod1 protein in the OB of Bod1f/f mice and Bod1-deficient mice (n = 3 in each group). (J) Examples and criteria for spiking-LFP phase-locking raw data. Raw LFPs, bandpass-filtered LFPs, and representative raster plots of 2 M/T cells (MC1 and MC2) recorded simultaneously in the OB. (K) Quantification of the mean firing rate in Bod1f/f and Bod1-deficient mice during the exploring state. (L) Correlation between firing rate and total time spent exploring zone A (n = 14 in each group). (M) Representative circular distribution of mean spike locking to theta, beta, and gamma phase angles for the 2 M/T cells in (J). (N) Ratio of M/T cells locked to a given frequency band during the quiet (left) and exploration (right) states (n = 21cells in Bod1f/f mice, n = 18 cells in Bod1-deficient mice). Data are presented as mean ± SEM; *P < 0.05. Two-way ANOVA for (N). Unpaired 2-tailed Student’s t test for (F), (I), and (K).
