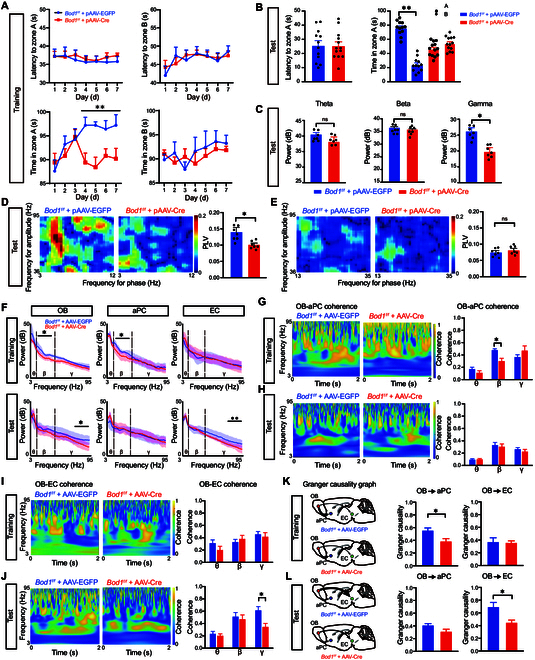
Fig. 6.

Bod1 deficiency in M/T cells induces cognitive memory deficits by abating oscillatory activity in the OB and neural coherence across OBM/T→aPC and OBM/T→EC circuits. (A and B) Quantification of latency to zone A and B and total time in zone A and B during the training (A) and test sessions (B) in Bod1f/f (n = 12) and Bod1-deficient mice (n = 13). (C) Representative raw LFPs, bandpass-filtered LFPs, and quantification of the powers of the theta, beta, and gamma bands during the test session (n = 7 in each group). (D and E) Overall standard PAC comodulogram of the phase locking value (PLV) for theta phase–gamma amplitude coupling (D) or beta phase–gamma amplitude coupling (E) between Bod1f/f and Bod1-deficient mice across the test session (n = 7 in each group). (F) Power spectrum of LFPs in Bod1-deficient mice or Bod1f/f mice during the training and test session. LFP recording in the OB, aPC, and EC simultaneously in the olfactory-related working memory test. (G and H) Quantification of the OB-aPC coherence of LFPs in Bod1-deficient mice or Bod1f/f mice in the training (G) and test session (H) (n = 7 in each group). (I and J) Quantification of the OB-EC coherence of LFPs in Bod1-deficient mice or Bod1f/f mice during the training (I) and test session (J) (n = 7 in each group). (K and L) Spectral Granger causality averaged over OB-aPC and OB-EC electrode pairs in Bod1-deficient mice or Bod1f/f mice during the training session (K) and test session (L) (n = 7 in each group). Data are presented as mean ± SEM; *P < 0.05, **P < 0.01. Two-way ANOVA for (A), (B) (right), and (G) to (J). Unpaired 2-tailed Student’s t test for (B) (left), (C) to (E), (K), and (L).
